



Probability is a number from 0 to 1 that tells how likely an event is. Theoretical probability is favorable outcomes divided by all equally likely outcomes. Experimental probability is the relative frequency found from data. A probability model lists every outcome with its probability, and the probabilities add to 1.
Key facts:
- Probability 0 means impossible, 1 means certain, and \(\frac{1}{2}\) means as likely as not.
- Theoretical probability = favorable outcomes divided by possible outcomes (equally likely).
- Experimental probability = number of times it happened divided by number of trials.
- In every probability model the probabilities add to 1; a uniform model has equal probabilities.
- Expected count = probability times number of trials; compare it with the observed count.
What is probability?
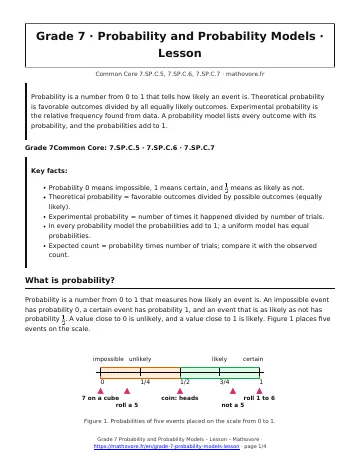
Probability is a number from 0 to 1 that measures how likely an event is. An impossible event has probability 0, a certain event has probability 1, and an event that is as likely as not has probability \(\frac{1}{2}\). A value close to 0 is unlikely, and a value close to 1 is likely. Figure 1 places five events on the scale.
An event and its opposite always add to 1, so \(P(\text{not } A) = 1 – P(A)\).
How do you find a theoretical probability?
\(P(\text{event}) = \frac{\text{number of favorable outcomes}}{\text{number of possible outcomes}}\)
This works when all outcomes are equally likely.
The bag in Figure 2 holds 12 marbles. Without looking, \(P(\text{green}) = \frac{5}{12}\) and \(P(\text{not green}) = 1 – \frac{5}{12} = \frac{7}{12}\).
What is experimental probability?
Experimental probability comes from data. It is the relative frequency: the number of times the event happened divided by the number of trials. Jamal rolled a number cube 60 times and got a 6 ten times , so his experimental probability of a 6 is \(\frac{10}{60} = \frac{1}{6}\). A fair cube should show each face about 10 times , and the bars in Figure 3 stay close to that line. In 300 rolls, expect about \(\frac{1}{6} \times 300 = 50\) sixes.
What is a probability model?
A probability model lists every outcome with its probability. Each probability is between 0 and 1, and all of them add to 1. In a uniform model every outcome has the same probability, such as \(\frac{1}{6}\) for each face of a fair cube. In a non-uniform model the probabilities differ, as for the spinner in Figure 4. When outcomes are not equally likely and cannot be counted, such as a tossed paper cup, build the model from observed relative frequencies.
How do you compare a prediction with observed results?
- Build the model, either uniform or from data.
- Multiply each probability by the number of trials to get the expected count. For a fair cube rolled 60 times , \(\frac{1}{6} \times 60 = 10\).
- Collect the observed counts (8, 12, 9, 11, 10, and 10).
- Find the differences. Here they are at most 2, so the data fit a fair cube well. Large differences suggest the model is wrong.
Probability and Probability Models: frequently asked questions
Can a probability be greater than 1 or less than 0?
No. A probability is always a number from 0 to 1. A value of 0 means the event cannot happen, and a value of 1 means it always happens. Any answer outside that range signals a mistake.
What is the difference between theoretical and experimental probability?
Theoretical probability is found by reasoning about equally likely outcomes, such as \(\frac{1}{6}\) for one face of a fair cube. Experimental probability is found by repeating the process and dividing the number of successes by the number of trials.
What makes a probability model uniform?
In a uniform model all outcomes have the same probability. A fair coin and a fair number cube are uniform. A spinner with sectors of different sizes is not uniform.
Why do experimental results differ from the prediction?
Chance causes variation. A fair cube rolled 60 times will rarely show every face exactly 10 times . With more trials the relative frequencies usually move closer to the theoretical probabilities.
How do you predict how many times an event will happen?
Multiply the probability by the number of trials. If the probability of green is \(\frac{1}{4}\) and a spinner is spun 200 times , expect about 50 greens. The real count is usually close, but not exact.
See every chapter on the Grade 7 math page.