



Ten multiple-choice questions check populations and samples, random and biased sampling, and estimates from samples. Several questions include a diagram. Choose the one correct answer, then read the explanation to see the common mistake behind each wrong choice.
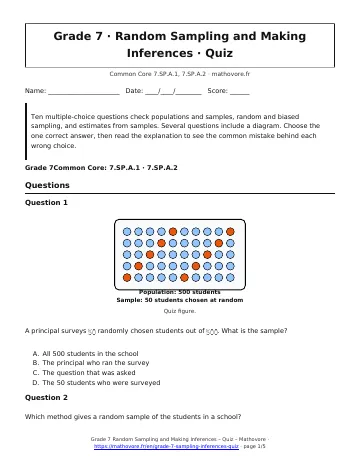
A principal surveys \(50\) randomly chosen students out of \(500\). What is the sample?
Which method gives a random sample of the students in a school?
A pizzeria asks 40 customers which topping they like best to find the favorite topping in the whole town. Why is the sample biased?
In a random sample of \(50\) students, \(20\) ride the bus. About how many of the \(800\) students ride the bus?
Which sample is likely to give the most reliable estimate of the percent of students who like a new cafeteria menu?
A random sample of \(5\) students reports their math homework time, in minutes. What is the sample mean?
Three random samples of \(40\) students each from the same school give \(14\), \(18\), and \(16\) students who walk. Why do the results differ?
In a random sample of \(30\) students, \(9\) own a bike. About how many of \(1,500\) students own a bike?
A random sample of \(50\) voters shows that \(36\) prefer a new library. What is the best estimate of the percent of all voters who prefer it?
Four random samples of \(20\) students gave the counts shown who like soccer. What is the best estimate of the percent of all students who like soccer?
🎉 Quiz complete!
Remember:
- A population is the whole group; a sample is a part of it.
- A random sample gives every member an equal chance of selection.
- Biased samples favor some members and lead to unreliable inferences.
- Estimate a population count: sample proportion times population size.
- Different random samples vary; larger samples vary less.
See every chapter on the Grade 7 math page.