


To compare two populations, find a measure of center and a measure of variability for a random sample from each one. When the variability is similar, divide the difference of the centers by the mean absolute deviation (MAD). A result of 2 means the centers are 2 MADs apart, so the two distributions overlap only a little.
Key facts:
- Compare centers with the mean or median, and spread with the MAD or IQR.
- Difference of the means divided by the MAD tells how many spreads apart the centers are.
- The larger the multiple, the less the two distributions overlap.
- Random samples make informal inferences about the whole populations reasonable.
- Another random sample gives slightly different numbers, so conclusions stay informal.
What does it mean to compare two populations?
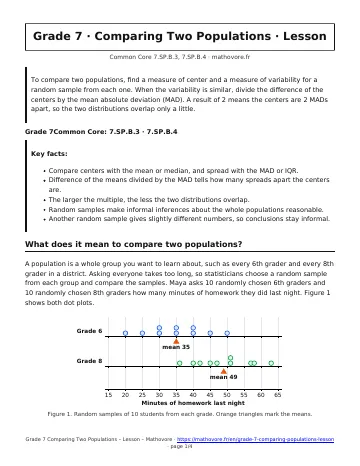
A population is a whole group you want to learn about, such as every 6th grader and every 8th grader in a district. Asking everyone takes too long, so statisticians choose a random sample from each group and compare the samples. Maya asks 10 randomly chosen 6th graders and 10 randomly chosen 8th graders how many minutes of homework they did last night. Figure 1 shows both dot plots.
How do you measure the difference between two centers?
The means are 35 minutes and 49 minutes, so the centers differ by \(49 – 35 = 14\) minutes. Whether 14 minutes is a big gap depends on how spread out the data are. Measure the gap in units of variability.
\(\text{multiple} =\frac{\text{difference of the means}}{\text{MAD}}\)
Use this when the two samples have similar variability.
The mean absolute deviation (MAD) is the mean of the distances from the mean. The 6th-grade distances are 15, 10, 5, 5, 0, 0, 5, 5, 10, and 15. They add to 70, so the MAD is \(70 : 10 = 7\). The 8th-grade distances also add to 70, so that MAD is 7 as well. The variabilities match, and \(\frac{14}{7} = 2\), so the centers are 2 MADs apart.
How do box plots show a comparison?
A box plot shows the median and the middle half of the data. In Figure 3 the median is 35 minutes for 6th grade and 49 minutes for 8th grade. The boxes do not overlap: the middle half of 6th graders spans 30 to 40 minutes, and the middle half of 8th graders spans 42 to 57 minutes.
What does the overlap tell you?
The ranges in Figure 4 overlap from 36 to 50 minutes, so some 6th graders work as long as some 8th graders. Still, two MADs is a clear gap between typical values. Because the samples are random, Maya can infer that 8th graders in the district typically do more homework. This is an informal inference, since another random sample would give slightly different numbers.
What are the steps?
- Check that each sample is random and the variabilities are similar.
- Find the mean of each sample (35 and 49).
- Find the MAD of each sample (7 and 7).
- Divide the difference of the means by the MAD (\(14 : 7 = 2\)).
- Say what it means: 8th graders typically do about 2 MADs, or 14 minutes, more homework.
Comparing Two Populations: frequently asked questions
What is a population in statistics?
A population is the entire group you want to know about, such as all students in a school district. A sample is a smaller part of it. A random sample gives every member an equal chance of being chosen.
Why divide the difference of the means by the MAD?
A gap of 14 minutes is large for tightly packed data and small for widely spread data. Dividing by the MAD turns the gap into a number of typical spreads, which makes different data sets easy to compare.
What if the two samples have different variability?
Then one multiple of one MAD is less meaningful. Describe the centers and the spreads separately, and say that the spreads are different instead of using a single multiple.
How many MADs apart is a big difference?
There is no single cutoff in Grade 7. A difference near 1 MAD shows heavy overlap, while a difference of 2 or 3 MADs or more shows a clear separation between the typical values.
Can a sample prove something about a population?
No. A random sample only supports an informal inference. The sample means will change a little from sample to sample, so a conclusion should say “typically” or “about”.
See every chapter on the Grade 7 math page.