



Two quantities are proportional when the ratio \(\frac{y}{x}\) is the same for every pair of values. That constant ratio is the constant of proportionality \(k\), also called the unit rate. On a graph, a proportional relationship is a straight line through the origin \((0,0)\) that contains the point \((1,k)\).
Key facts:
- A relationship is proportional when \(\frac{y}{x}\) is the same constant \(k\) for every pair.
- The constant of proportionality \(k\) equals the unit rate: the value of \(y\) when \(x=1\).
- A graph is proportional only if it is a straight line through \((0,0)\).
- The point \((1,k)\) on a proportional graph shows the unit rate.
- A table that does not give a constant ratio, or a line that misses the origin, is not proportional.
What is a proportional relationship?
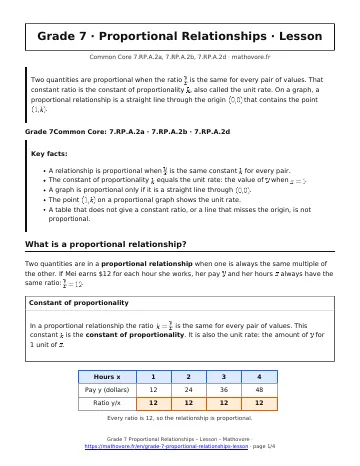
Two quantities are in a proportional relationship when one is always the same multiple of the other. If Mei earns $12 for each hour she works, her pay \(y\) and her hours \(x\) always have the same ratio: \(\frac{y}{x}=12\).
In a proportional relationship the ratio \(k=\frac{y}{x}\) is the same for every pair of values. This constant \(k\) is the constant of proportionality. It is also the unit rate: the amount of \(y\) for 1 unit of \(x\).
How do you decide from a table?
- Divide \(y\) by \(x\) for every pair in the table.
- If all the ratios are equal, the relationship is proportional and the common ratio is \(k\).
- If even one ratio is different, the relationship is not proportional.
Example. A table has \(x=1,2,3,4\) and \(y=5,8,11,14\). The ratios are \(\frac{5}{1}=5\), \(\frac{8}{2}=4\) and \(\frac{11}{3}\approx 3.67\). They are not equal, so the relationship is not proportional.
How do you decide from a graph?
The graph of a proportional relationship is a straight line that passes through the origin \((0,0)\). If the line is crooked, or if it crosses the \(y\)-axis above or below zero, the relationship is not proportional.
What do the points (0, 0) and (1, r) mean?
The point \((0,0)\) says that 0 of one quantity goes with 0 of the other: 0 pounds of grapes cost $0. The point \((1,r)\) shows the unit rate \(r\): the value of \(y\) when \(x=1\). Here \(r\) equals \(k\). If grapes cost $2.50 per pound, the graph contains \((1,2.50)\).
Proportional Relationships: frequently asked questions
How can I tell if a table is proportional?
Divide \(y\) by \(x\) in every row. If every quotient is the same number, the table is proportional and that number is \(k\). One different quotient means it is not proportional.
Why must a proportional graph pass through the origin?
If \(x=0\), then \(y=k\cdot 0=0\). So the point \((0,0)\) is always on the graph. A line that crosses the \(y\)-axis anywhere else does not represent a proportional relationship.
Is any straight line proportional?
No. The line must also pass through \((0,0)\). A line such as the one through \((0,2)\) and \((1,4)\) is straight, but it is not proportional because it misses the origin.
What does the point (1, r) tell you?
It tells you the unit rate. When \(x=1\), the value of \(y\) is \(r\), and \(r\) equals the constant of proportionality \(k\). For $2.50 per pound, \((1,2.50)\) is on the graph.
What words suggest a proportional relationship?
Phrases such as per, for each and for every often describe a constant ratio. A fixed starting fee added to a per-unit charge is not proportional, however.
See every chapter on the Grade 7 math page.