
Mathovore, everything you need to succeed in math: Common Core lessons, worksheets, tests and quizzes
Skip to content

Probability and Probability Models: Grade 7 Math Quiz – PDF Download

    Probability and Probability Models – Grade 7 math quiz
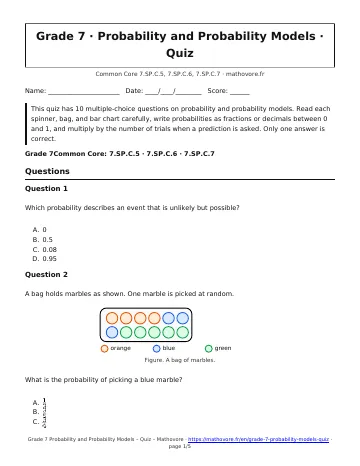
    This quiz has 10 multiple-choice questions on probability and probability models. Read each spinner, bag, and bar chart carefully, write probabilities as fractions or decimals between 0 and 1, and multiply by the number of trials when a prediction is asked. Only one answer is correct.
    Grade 7Common Core: 7.SP.C.5 · 7.SP.C.6 · 7.SP.C.7
    🎯 Probability and Probability Models – Grade 7 math quiz
    Score: 0 / 10
    Answered: 0 / 10
    Question 1

    Which probability describes an event that is unlikely but possible?

    A 0
    B 0.5
    C 0.08
    D 0.95
    Question 2

    A bag holds marbles as shown. One marble is picked at random.

    orangebluegreen
    Figure. A bag of marbles.

    What is the probability of picking a blue marble?

    A \(\frac{1}{3}\)
    B \(\frac{3}{5}\)
    C \(\frac{3}{4}\)
    D \(\frac{1}{4}\)
    Question 3

    The spinner has 8 equal sectors.

    12345678
    Figure. A spinner with 8 equal sectors.

    What is the probability of landing on a number less than 3?

    A \(\frac{1}{3}\)
    B \(\frac{3}{8}\)
    C \(\frac{1}{8}\)
    D \(\frac{1}{4}\)
    Question 4

    The bar chart shows the results of 40 spins.

    04812162018Red10Blue8Green4YellowColorNumber of spins
    Figure. Results of 40 spins.

    What is the experimental probability of blue?

    A \(\frac{1}{3}\)
    B \(\frac{1}{4}\)
    C \(\frac{1}{10}\)
    D \(\frac{2}{5}\)
    Question 5

    The probability that a train is late is 0.3. What is the probability that the train is not late?

    A 0.3
    B 1.3
    C 0.03
    D 0.7
    Question 6

    The probability of landing on red is \(\frac{2}{5}\). About how many reds should be expected in 150 spins?

    A 30
    B 75
    C 60
    D 375
    Question 7

    Which list could be a probability model for three outcomes?

    A 0.5, 0.3, 0.2
    B 0.5, 0.4, 0.2
    C 0.4, 0.3, 0.2
    D 0.6, 0.6, -0.2
    Question 8

    Ava rolled a cube 60 times. If the cube is fair, each face is expected 10 times.

    024681012147112293114105116expected 10FaceTimes rolled
    Figure. 60 rolls of a cube. The dashed line marks 10.

    Which face is farthest from the expected count?

    A Face 1, which is 3 below 10
    B Face 2, which is 2 above 10
    C Face 3, which is 1 below 10
    D Face 5, which is on the line
    Question 9

    A fair number cube is rolled once. What is the probability of rolling a prime number?

    A \(\frac{1}{3}\)
    B \(\frac{1}{2}\)
    C \(\frac{2}{3}\)
    D \(\frac{1}{6}\)
    Question 10

    A paper cup landed on its side 41 times in 100 tosses. About how many side landings should be expected in 200 tosses?

    A 41
    B 82
    C 164
    D 8

    🎉 Quiz complete!

    0 / 10

    Remember:

    • Probability 0 means impossible, 1 means certain, and \(\frac{1}{2}\) means as likely as not.
    • Theoretical probability = favorable outcomes divided by possible outcomes (equally likely).
    • Experimental probability = number of times it happened divided by number of trials.
    • In every probability model the probabilities add to 1; a uniform model has equal probabilities.
    • Expected count = probability times number of trials; compare it with the observed count.
    See every chapter on the Grade 7 math page.

    Voter... post

    More Grade 7 math

    Adding and Subtracting Integers and Rational Numbers

    Angle Relationships

    Area, Surface Area and Volume of Prisms

    Circumference and Area of Circles

    Random Sampling and Making Inferences

    Probability of Compound Events