


This test covers populations and samples, random and biased sampling, and estimates from a sample, including variation among samples. Show your work, and write estimates with the word about. The test has 8 questions and is worth 20 points. Plan for about 45 minutes.
- Grade: Grade 7
- Chapter: Random Sampling and Making Inferences
- Common Core: 7.SP.A.1, 7.SP.A.2
- Time: 45 minutes
- Total: 20 points (Question 1: 2 pts; Question 2: 2 pts; Question 3: 2 pts; Question 4: 3 pts; Question 5: 2 pts; Question 6: 3 pts; Question 7: 2 pts; Question 8: 4 pts)
Question 1: Population and sample (2 points)
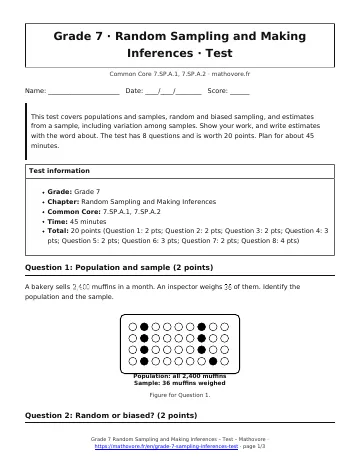
A bakery sells \(2,400\) muffins in a month. An inspector weighs \(36\) of them. Identify the population and the sample.
Question 2: Random or biased? (2 points)
Ethan wants to estimate the mean number of hours students at his school sleep on school nights. For each method, tell whether the sample is random or biased and explain. (a) He emails every student a survey, and uses the 40 who reply. (1 point) (b) He numbers the students on the roster, and uses a random number generator to pick 40. (1 point)
Question 3: Explain the bias (2 points)
A radio host asks listeners to call in and say whether the town should build a new skate park. Of the \(120\) callers, \(96\) say yes. Explain why this is not a good basis for saying that most people in town want the skate park.
Question 4: Estimating a proportion (3 points)
A random sample of \(60\) students at a school with \(1,800\) students shows that \(21\) own a pet. Estimate how many students at the school own a pet.
Question 5: Estimating a mean (2 points)
A forester measures a random sample of \(6\) trees in a large forest. Their heights, in feet, are \(18, 22, 20, 25, 19, 22\). Estimate the mean height of all the trees in the forest.
Question 6: Variation among samples (3 points)
Eight random samples of \(25\) customers each were asked whether they prefer chocolate ice cream. The dot plot shows how many in each sample said yes.
- Find the range of the eight results. (1 point)
- Find the mean result, and use it to estimate how many of \(2,000\) customers prefer chocolate. (2 points)
Question 7: Sample size (2 points)
Sofia and Mei each take a random sample to estimate the percent of students who prefer a longer lunch period. Sofia surveys \(8\) students. Mei surveys \(80\) students. Whose estimate is likely to be closer to the true percent? Explain.
Question 8: Design and use a survey (4 points)
Ms. Reed wants to learn how much homework students do. The school has \(360\) students. (a) Describe a method to choose a random sample of \(24\) students. (2 points) (b) In her sample, \(9\) students said they get too much homework. Estimate how many of the \(360\) students would say the same. (2 points)

See every chapter on the Grade 7 math page.