



Use this key to score the test out of 20 points. Each solution shows the proportion or mean used for the estimate, and each scoring note explains how partial credit is given. For explanation questions, accept any correct reasoning about equal chance of selection, bias, or sample size.
Question 1: Population and sample (2 points)
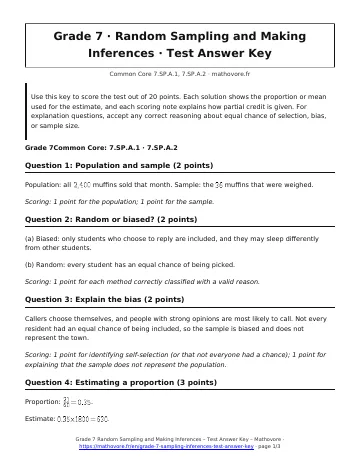
Population: all \(2,400\) muffins sold that month. Sample: the \(36\) muffins that were weighed.
Scoring: 1 point for the population; 1 point for the sample.
Question 2: Random or biased? (2 points)
(a) Biased: only students who choose to reply are included, and they may sleep differently from other students.
(b) Random: every student has an equal chance of being picked.
Scoring: 1 point for each method correctly classified with a valid reason.
Question 3: Explain the bias (2 points)
Callers choose themselves, and people with strong opinions are most likely to call. Not every resident had an equal chance of being included, so the sample is biased and does not represent the town.
Scoring: 1 point for identifying self-selection (or that not everyone had a chance); 1 point for explaining that the sample does not represent the population.
Question 4: Estimating a proportion (3 points)
Proportion: \(\frac{21}{60}=0.35\).
Estimate: \(0.35\times 1800=630\).
About \(630\) students
Scoring: 1 point for the proportion \(0.35\); 1 point for multiplying by \(1800\); 1 point for \(630\).
Question 5: Estimating a mean (2 points)
Sum: \(18+22+20+25+19+22=126\). Mean: \(126: 6=21\).
About \(21\text{ ft}\)
Scoring: 1 point for the sum \(126\); 1 point for the estimate \(21\text{ ft}\).
Question 6: Variation among samples (3 points)
(a) Largest \(14\), smallest \(10\): range \(14-10=4\).
(b) Sum: \(11+13+12+14+12+10+12+12=96\), and \(96: 8=12\). Proportion: \(\frac{12}{25}=0.48\), and \(0.48\times 2000=960\).
(a) 4; (b) about 960 customers
Scoring: 1 point for (a); 1 point for the mean \(12\); 1 point for the estimate \(960\).
Question 7: Sample size (2 points)
Mei’s estimate is likely closer. A larger random sample varies less from sample to sample, so it tends to be closer to the population value.
Scoring: 1 point for choosing Mei; 1 point for a reason about larger samples varying less.
Question 8: Design and use a survey (4 points)
(a) Sample answer: Number the students \(1\) to \(360\) on a roster. Use a random number generator to pick \(24\) different numbers, and survey those students. Every student has the same chance.
(b) \(\frac{9}{24}=0.375\), and \(0.375\times 360=135\).
(b) About \(135\) students
Scoring: (a) 1 point for a method where chance decides; 1 point for giving every student an equal chance. (b) 1 point for \(0.375\); 1 point for \(135\).
20 points
See every chapter on the Grade 7 math page.