


This answer key gives every distance and every division for the 20 problems on comparing two populations. Check each mean first, then the MAD, and finally the multiple. A wrong mean changes every distance, so find that error before anything else.
Problem 1: Find the mean
Add: \(12 + 15 + 9 + 18 + 14 + 16 = 84\).
Divide by 6: \(84 : 6 = 14\).
The mean is 14 pages per night.
Problem 2: Mean from a dot plot
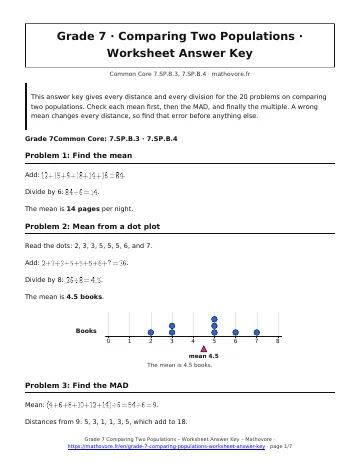
Read the dots: 2, 3, 3, 5, 5, 5, 6, and 7.
Add: \(2 + 3 + 3 + 5 + 5 + 5 + 6 + 7 = 36\).
Divide by 8: \(36 : 8 = 4.5\).
The mean is 4.5 books.
Problem 3: Find the MAD
Mean: \((4 + 6 + 8 + 10 + 12 + 14) : 6 = 54 : 6 = 9\).
Distances from 9: 5, 3, 1, 1, 3, 5, which add to 18.
MAD: \(18 : 6 = 3\). The MAD is 3.
Problem 4: MAD with a decimal
Mean: \((3 + 5 + 6 + 9 + 12) : 5 = 35 : 5 = 7\).
Distances from 7: 4, 2, 1, 2, 5. Their sum is \(4 + 2 + 1 + 2 + 5 = 14\).
MAD: \(14 : 5 = 2.8\).
The MAD is 2.8.
Problem 5: Median and IQR
Order the data: 6, 8, 9, 11, 12, 14, 15, 18, 20.
The middle value is the fifth one, so the median is \(12\).
Lower half: 6, 8, 9, 11, so \(Q_1 = (8 + 9) : 2 = 8.5\). Upper half: 14, 15, 18, 20, so \(Q_3 = (15 + 18) : 2 = 16.5\).
\(\text{IQR} = 16.5 – 8.5 = 8\).
The median is 12 minutes and the IQR is 8 minutes.
Problem 6: Difference as a multiple
Difference of the means: \(9.5 – 6.5 = 3\) inches.
Divide by the MAD: \(3 : 1.5 = 2\).
The means differ by 2 MADs.
Problem 7: Compare two dot plots
Eagles: \(12 + 14 + 14 + 16 + 16 + 18 + 18 + 20 = 128\) and \(128 : 8 = 16\). Distances: 4, 2, 2, 0, 0, 2, 2, 4, total 16, so the MAD is \(16 : 8 = 2\).
Hawks: \(8 + 10 + 10 + 12 + 12 + 14 + 14 + 16 = 96\) and \(96 : 8 = 12\). Distances: 4, 2, 2, 0, 0, 2, 2, 4, total 16, so the MAD is 2.
The difference of the means is \(16 – 12 = 4\), and \(4 : 2 = 2\).
The means are 16 and 12, both MADs are 2, and the means are 2 MADs apart.
Problem 8: Missing value from the mean
(a) Five scores with a mean of 84 add to \(5 \times 84 = 420\). The four known scores add to \(90 + 78 + 85 + 81 = 334\). The fifth score is \(420 – 334 = 86\).
(b) Distances from 84: 6, 6, 1, 3, 2. Their sum is \(6 + 6 + 1 + 3 + 2 = 18\), so the MAD is \(18 : 5 = 3.6\).
The fifth score is 86 and the MAD is 3.6.
Problem 9: Same mean, different MAD
- Sofia: \(48 : 8 = 6\). Distances: 2, 2, 1, 1, 1, 1, 2, 2, sum 12, MAD \(12 : 8 = 1.5\). Diego: \(48 : 8 = 6\). Distances: 4, 3, 2, 0, 0, 2, 3, 4, sum 18, MAD \(18 : 8 = 2.25\).
- The means are equal, so the difference is \(6 – 6 = 0\). That is 0 MADs.
- Sofia is more consistent because her MAD is smaller. \(2.25 : 1.5 = 1.5\), so Diego’s darts are 1.5 times as spread out.
Problem 10: Compare box plots
Rockets: median 30, Q1 20, Q3 40, so IQR \(40 – 20 = 20\).
Comets: median 45, Q1 35, Q3 55, so IQR \(55 – 35 = 20\).
Difference of the medians: \(45 – 30 = 15\). Then \(15 : 20 = 0.75\).
The medians are 0.75 IQR apart (medians 30 and 45, both IQRs 20).
Problem 11: Spread of two box plots
- Brown: median \(72\), \(\text{IQR} = 78 – 66 = 12\). Lee: median \(84\), \(\text{IQR} = 96 – 72 = 24\).
- Ms. Lee’s class varies more. \(24 : 12 = 2\), so her IQR is 2 times as large.
- The medians differ by \(84 – 72 = 12\). The larger IQR is 24, and \(12 : 24 = 0.5\). The medians are 0.5 of an IQR apart.
Problem 12: Work backward to the MAD
(a) The difference of the means is \(51 – 37 = 14\). Then \(14 = 3.5 \times \text{MAD}\), so \(\text{MAD} = 14 : 3.5 = 4\).
(b) Two MADs is \(2 \times 4 = 8\) minutes, and \(37 – 8 = 29\).
The MAD is 4 minutes and the third mean is 29 minutes.
Problem 13: Describe the overlap
Class A: the sum is 200, so the mean is \(200 : 10 = 20\). Distances: 3, 2, 1, 0, 0, 0, 0, 1, 2, 3, total 12, so the MAD is \(12 : 10 = 1.2\).
Class B: every value is 9 more than in Class A, so the mean is 29 and the MAD is 1.2.
Difference: \(29 – 20 = 9\), and \(9 : 1.2 = 7.5\).
The means are 7.5 MADs apart. The greatest time in Class A is 23 and the least in Class B is 26, so the distributions do not overlap.
Problem 14: Two school samples
Lincoln: the sum is 600, so the mean is 60. Distances: 30, 25, 5, 0, 0, 0, 5, 5, 25, 25, total 120, so the MAD is \(120 : 10 = 12\).
Roosevelt: the sum is 840, so the mean is 84. Distances: 29, 19, 4, 4, 4, 1, 1, 6, 21, 31, total 120, so the MAD is 12.
Difference: \(84 – 60 = 24\), and \(24 : 12 = 2\).
The means are 2 MADs apart. Students at Roosevelt typically play about 24 minutes more on Saturday than students at Lincoln.
Problem 15: Cafeteria wait times
(a) East: sum 70, mean \(70 : 10 = 7\). Distances: 2, 2, 1, 1, 0, 0, 1, 1, 2, 2, sum 12, MAD \(12 : 10 = 1.2\).
West: sum 130, mean \(130 : 10 = 13\). Distances: 4, 3, 2, 1, 0, 0, 1, 2, 3, 4, sum 20, MAD \(20 : 10 = 2\).
(b) The means differ by \(13 – 7 = 6\). The larger MAD is 2, and \(6 : 2 = 3\). The means are 3 MADs apart.
(c) The West line is slower by 6 minutes on average, and its wait times are also more spread out.
Problem 16: Tomato weights
Garden P: the sum is 72, so the mean is \(72 : 8 = 9\) ounces. Distances: 4, 1, 1, 0, 0, 1, 2, 3, total 12, so the MAD is \(12 : 8 = 1.5\).
Garden Q: the sum is 48, so the mean is \(48 : 8 = 6\) ounces. Distances: 3, 2, 1, 0, 0, 1, 1, 4, total 12, so the MAD is 1.5.
Difference: \(9 – 6 = 3\), and \(3 : 1.5 = 2\).
The means are 2 MADs apart.
Problem 17: Fertilizer and plant height
(a) Brand X: sum 136, mean \(136 : 8 = 17\). Distances: 3, 2, 1, 0, 0, 1, 2, 3, sum 12, MAD \(12 : 8 = 1.5\).
Brand Y: sum 172, mean \(172 : 8 = 21.5\). Distances: 4.5, 2.5, 1.5, 0.5, 0.5, 1.5, 2.5, 4.5, sum 18, MAD \(18 : 8 = 2.25\).
(b) The means differ by \(21.5 – 17 = 4.5\). The larger MAD is 2.25, and \(4.5 : 2.25 = 2\). The means are 2 MADs apart.
(c) Brand X has the smaller MAD, so its plant heights are more consistent.
Problem 18: July temperatures
Tulsa: the sum is 860, so the mean is 86 °F. Distances: 7, 5, 2, 1, 0, 0, 1, 3, 5, 6, total 30, so the MAD is \(30 : 10 = 3\) °F.
Portland: the sum is 770, so the mean is 77 °F. Distances: 4, 4, 3, 3, 1, 0, 0, 2, 6, 7, total 30, so the MAD is 3 °F.
Difference: \(86 – 77 = 9\), and \(9 : 3 = 3\).
The spreads are equal, and the Tulsa mean is 3 MADs (9 °F) warmer than the Portland mean.
Problem 19: Pizza delivery times
(a) Shop A: median \(25\). Lower half 18, 20, 22, 24 gives \(Q_1 = 21\); upper half 27, 29, 31, 35 gives \(Q_3 = 30\). \(\text{IQR} = 30 – 21 = 9\).
Shop B: median \(34\). Lower half 27, 29, 31, 33 gives \(Q_1 = 30\); upper half 36, 38, 40, 47 gives \(Q_3 = 39\). \(\text{IQR} = 39 – 30 = 9\).
(b) The medians differ by \(34 – 25 = 9\), and \(9 : 9 = 1\). The medians are 1 IQR apart.
(c) The ranges are \(35 – 18 = 17\) and \(47 – 27 = 20\). Shop B has one very slow order (47 minutes) that stretches its range, while both IQRs are 9. The IQR describes the typical spread better because it ignores that single extreme value.
Problem 20: Sprint times
-
1.5 MADs is \(1.5 \times 0.8 = 1.2\) seconds.
Group B mean: \(14.2 – 1.2 = 13.0\).
The mean time of Group B is 13.0 seconds.
-
The means are only 1.5 MADs apart, so the two distributions overlap. A slow runner in Group B can still be slower than a fast runner in Group A. A difference in the typical values does not mean that every runner differs.
See every chapter on the Grade 7 math page.