
Key takeaway: This grade 7 comparing populations test takes 45 minutes and offers eight questions worth 20 points. It covers medians, IQR, MAD, dot plots, box plots, and the gap between two centers expressed as a multiple of the spread. Grading notes sit in a separate key.
Students show every step and write answers in full sentences when the question asks for a conclusion. One item presents a classmate’s claim, so students must find the error. Another works backward from a known multiple to the MAD.
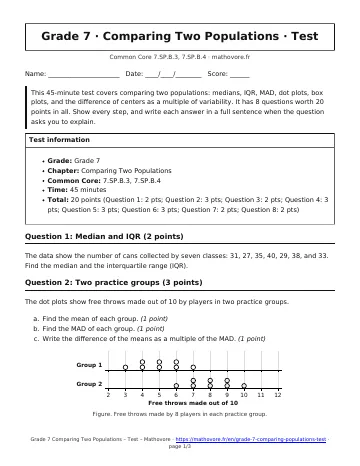
This 45-minute test covers comparing two populations: medians, IQR, MAD, dot plots, box plots, and the difference of centers as a multiple of variability. It has 8 questions worth 20 points in all. Show every step, and write each answer in a full sentence when the question asks you to explain.
- Grade: Grade 7
- Chapter: Comparing Two Populations
- Common Core: 7.SP.B.3, 7.SP.B.4
- Time: 45 minutes
- Total: 20 points (Question 1: 2 pts; Question 2: 3 pts; Question 3: 2 pts; Question 4: 3 pts; Question 5: 3 pts; Question 6: 3 pts; Question 7: 2 pts; Question 8: 2 pts)
Grade 7 Comparing Populations Test: questions 1–5
1. Median and IQR (2 points)
The data show the number of cans collected by seven classes: 31, 27, 35, 40, 29, 38, and 33. Find the median and the interquartile range (IQR).
2. Two practice groups (3 points)
The dot plots show free throws made out of 10 by players in two practice groups.
- Find the mean of each group. (1 point)
- Find the MAD of each group. (1 point)
- Write the difference of the means as a multiple of the MAD. (1 point)
3. Text messages (2 points)
Two random samples of students sent text messages in one day. The first sample has a mean of 48 messages and the second has a mean of 66 messages. Both samples have a MAD of 9 messages.
- Write the difference of the means as a multiple of the MAD. (1 point)
- Suppose both MADs were 6 messages instead. Write the new multiple. (1 point)
4. Biking clubs (3 points)
The box plots show the miles biked in one week by random samples of members of two clubs.
- Find the median of each club and the difference of the medians. (1 point)
- Find the IQR of each club. (1 point)
- Do the boxes overlap? Explain. (1 point)
5. Typing speeds (3 points)
The dot plots show the words typed per minute by random samples from two classes. Both samples have a MAD of 2 words per minute.
- Find the mean of each class. (1 point)
- Write the difference of the means as a multiple of the MAD. (1 point)
- Describe the overlap of the two distributions. (1 point)
Grade 7 Comparing Populations Test: questions 6–8
6. Pages read (3 points)
Mei asked a random sample of 8 sixth graders and a random sample of 8 seventh graders how many pages they read last week.
Sixth grade: 23, 24, 27, 30, 31, 34, 34, 37.
Seventh grade: 32, 33, 34, 37, 38, 42, 42, 46.
- Find the mean and MAD of each sample. (2 points)
- Write a sentence that compares the two grades, using the multiple of the MAD. (1 point)
7. Find the error (2 points)
Group A has a mean of 70 and a MAD of 5. Group B has a mean of 80 and a MAD of 5. Jamal says, “Group B is 10 MADs higher than Group A.” Explain Jamal’s mistake and give the correct multiple.
8. Working backward (2 points)
Two samples have means of 120 and 150 and the same MAD. The difference of the means is 2.5 times the MAD.
- Find the MAD. (1 point)
- A third sample has a mean that is 1.5 MADs above 150. Find its mean. (1 point)

What is on the 7th grade comparing populations test?
The first question gives cans collected by seven classes: 31, 27, 35, 40, 29, 38, and 33, and asks for a median and an IQR. Next come dot plots of free throws made by two practice groups. Text messages, biking clubs, typing speeds, and pages read fill most of the remaining items.
How should you pace a grade 7 comparing populations test?
Allow roughly three minutes per 2-point question and six per 3-point question. The dot plot and box plot items need the most care. Copy the plotted values into a short list before you compute anything.
How do you find the error in a classmate’s claim?
Group A has a mean of 70 and Group B has a mean of 80, and both MADs are 5. Jamal says the groups are 10 MADs apart. The gap of 10 must be divided by the MAD of 5, so the groups are 2 MADs apart.
The working backward question gives means of 120 and 150 and a multiple of 2.5. Divide the difference of 30 by 2.5, and the MAD is 12.
Typing speeds in question 5 share a MAD of 2, so only the mean gap matters. Divide that gap by 2, then state in a sentence whether the classes overlap.
Study tips for the comparison test
Tonight, compute a MAD for three short lists and say each answer aloud in a sentence. Tomorrow, read two box plots and name the median gap. In the exam room, write the formula for the multiple at the top of the page before you begin.

See every chapter on the Grade 7 math page.