
Key takeaway: This grade 4 line plots lesson shows how a number line with fraction marks turns a list of measurements into a picture. One X sits above the number for each measurement, so a tall stack marks a common length. Fourth graders learn to read halves, fourths, and eighths, to build a plot from raw data, and to add or subtract the values. The page also explains which scale to pick. Along the way, each line plot example comes with a short check that confirms the answer.
A line plot with fractions is a graph that shows measurements on a number line marked in halves, fourths, or eighths. Each X or dot above a number stands for one measurement. To solve problems, read the values from the plot, then add or subtract fractions with the same denominator, for example \(1\frac{1}{2} – \frac{1}{2} = 1\).
Grade 4 Line Plots Lesson: key facts
- Each mark on a line plot stands for one measurement.
- Halves, fourths, and eighths split each inch into 2, 4, or 8 equal parts.
- The tallest stack of marks shows the most common value.
- To find how much longer, subtract the smaller value from the larger value.
- To find a total, add every value after writing them as fractions with the same denominator.
What is a line plot with fractions?
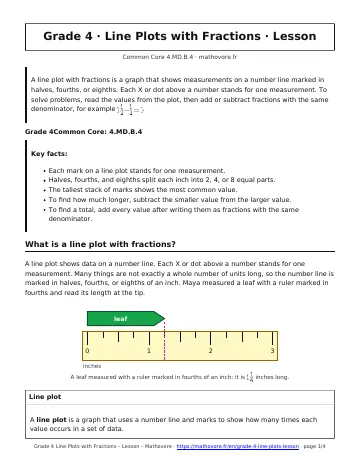
A line plot shows data on a number line. Each X or dot above a number stands for one measurement. Many things are not exactly a whole number of units long, so the number line is marked in halves, fourths, or eighths of an inch. Maya measured a leaf with a ruler marked in fourths and read its length at the tip.
A line plot is a graph that uses a number line and marks to show how many times each value occurs in a set of data.
How do you read the tick marks on a fraction number line?
Count the equal parts between 0 and 1. Two parts make halves, four parts make fourths, and eight parts make eighths. A mark that is 3 tick marks from 0 on an eighths scale is at \(\frac{3}{8}\). Always check the size of one step before you read a mark.
How do you make a line plot from measurements?
- Find the smallest and the largest measurement.
- Draw a number line that covers them, with tick marks in the same fraction as the data.
- Label the whole numbers and the key fractions.
- Make one mark above the number for each measurement and stack repeated values.
- Add a title and a unit label.
Maya measured nine leaves and plotted them. The tallest stack is above 1 inch, so 1 inch is the most common length.
How do you add and subtract fractions from a line plot?
First read the values from the plot. Then add or subtract the numerators and keep the denominator, because the fractions have the same unit. Regroup a mixed number when you need to.
How much longer is the longest leaf than the shortest leaf?
The longest leaf is \(1\frac{1}{2}\) inches and the shortest is \(\frac{1}{2}\) inch. Subtract: \(1\frac{1}{2} – \frac{1}{2} = 1\). The longest leaf is 1 inch longer.
To find a total, change every value to the same fourths. Together the two leaves at \(1\frac{1}{4}\) inches measure \(\frac{5}{4} + \frac{5}{4} = \frac{10}{4} = 2\frac{1}{2}\) inches.
Line Plots with Fractions: frequently asked questions
What is a line plot used for?
A line plot shows how a set of measurements is spread out along a number line. You can see the smallest value, the largest value, and the most common value at a glance.
How do I know what fraction each tick mark shows?
Count the equal spaces between two whole numbers. If there are 4 spaces, each one is \(\frac{1}{4}\). If there are 8 spaces, each one is \(\frac{1}{8}\).
How do I find the difference between the longest and shortest value?
Read both values from the plot and subtract the smaller one from the larger one. For leaves at \(1\frac{1}{2}\) and \(\frac{1}{2}\) inches, the difference is 1 inch.
How do I add the values on a line plot?
Write each value as a fraction with the same denominator, then add the numerators. Keep the denominator and change the answer to a mixed number if it is greater than 1.
Why do some marks stack on top of each other?
When several measurements are equal, their marks go on the same number. The height of the stack tells how many measurements have that value.
What does a grade 4 line plots lesson show about tick marks?
Start with a number line from 0 to 1 and cut each inch into 4 equal spaces. Then every mark stands for one fourth, so the third mark is \(\frac{3}{4}\). With eighths, the same inch holds 8 spaces. Because the spaces shrink, you must count carefully. Always read the labeled whole numbers first, and then count the small steps.
How do you make a line plot from measurements?
First, find the smallest and largest value in the list. Next, choose the spacing that lands on every measurement. For instance, lengths of \(\frac{1}{2}\), \(\frac{3}{4}\), and \(1\frac{1}{4}\) all fit on a fourths scale. After that, place one X for each measurement, stacking repeats. Finally, count the Xs to see whether they match the list.
How can a plot answer addition and subtraction questions?
To find how much longer the longest piece is, subtract the shortest value from the longest. To find a total, add the value of every X. Suppose three ribbons are each \(\frac{3}{4}\) foot. Then \(\frac{3}{4} + \frac{3}{4} + \frac{3}{4} = \frac{9}{4} = 2\frac{1}{4}\) feet.
What mistakes happen most often?
- Counting the tick marks instead of the Xs.
- Forgetting a repeated value when adding the total.
- Reading a mark on a fourths line as an eighth.
Your next practice steps
Next, copy a number line with fourths and plot six lengths from a ruler. Then write one subtraction question about your plot and solve it. After that, switch to eighths and compare how the picture changes. Finally, print the worksheet and begin at problem 1.

See every chapter on the Grade 4 math page.