This grade 3 graphs test checks scaled graphs and line plots in 45 minutes, with 8 questions for a total of 20 points.
This 45 minute test checks scaled picture graphs, scaled bar graphs, measuring with a ruler marked in halves and fourths of an inch, and line plots. Read each key and scale carefully. Show your work and write the unit in every answer. There are 8 questions worth 20 points.
- Grade: Grade 3
- Chapter: Scaled Graphs and Line Plots
- Common Core: 3.MD.B.3, 3.MD.B.4
- Time: 45 minutes
- Total: 20 points (Question 1: 3 pts; Question 2: 3 pts; Question 3: 2 pts; Question 4: 2 pts; Question 5: 3 pts; Question 6: 2 pts; Question 7: 2 pts; Question 8: 3 pts)
Grade 3 Graphs Test: questions 1–5
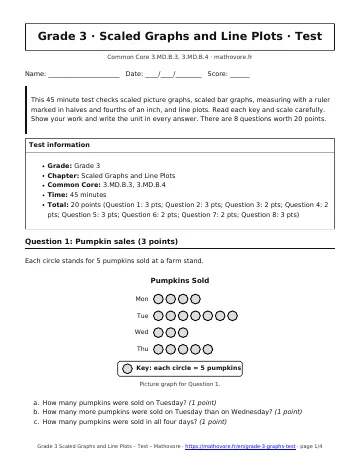
Question 1: Pumpkin sales (3 points)
Each circle stands for 5 pumpkins sold at a farm stand.
- How many pumpkins were sold on Tuesday? (1 point)
- How many more pumpkins were sold on Tuesday than on Wednesday? (1 point)
- How many pumpkins were sold in all four days? (1 point)
Question 2: Favorite subjects (3 points)
The bar graph shows the favorite school subjects of a third grade class.
- How many students chose Science? (1 point)
- How many more students chose PE than Reading? (1 point)
- How many students were asked in all? (1 point)
Question 3: Two lengths (2 points)
Measure each object to the nearest fourth of an inch.
- The ribbon (1 point)
- The stick (1 point)
Question 4: Make a line plot (2 points)
Eight shells have these lengths in inches: \(3\frac{1}{4}\), \(3\frac{1}{2}\), \(3\frac{1}{2}\), \(3\frac{3}{4}\), \(4\), \(3\frac{1}{2}\), \(3\frac{3}{4}\), \(4\frac{1}{4}\). Draw a line plot of the data. Use a number line from 3 to \(4\frac{1}{2}\) marked in fourths.
Question 5: Plant heights (3 points)
The line plot shows the heights of 10 bean plants.
- How many plants are \(2\frac{3}{4}\) inches tall? (1 point)
- How many plants are taller than 3 inches? (1 point)
- What is the most common height? (1 point)
Grade 3 Graphs Test: questions 6–8
Question 6: Sticker circles (2 points)
In a picture graph each circle stands for 8 stickers. Sofia’s row has 3 whole circles and 1 half circle. Liam’s row has 5 whole circles. How many more stickers does Liam have than Sofia?
Question 7: Pet counts (2 points)
The bar graph shows the pets in a neighborhood.
- How many pets are there in all? (1 point)
- How many fewer birds are there than dogs? (1 point)
Question 8: Graph squares (3 points)
Each square on a bar graph grid stands for 5 votes.
- The pizza bar is 9 squares tall. How many votes did pizza get? (1 point)
- The salad bar shows 30 votes. How many squares tall is it? (1 point)
- The taco bar is 7 squares tall. How many more votes did pizza get than tacos? (1 point)

How to use this grade 3 graphs test
Take this grade 3 graphs test without notes, then grade it with the test answer key out of 20 points.

See every chapter on the Grade 3 math page.