Key takeaway: This grade 3 graphs worksheet gives 22 printable problems on scaled picture graphs, scaled bar graphs, and line plots. First, problems 1 to 9 read keys and scales, so students find totals, how many more, and how many fewer. Next, problems 10 to 16 measure with a ruler marked in halves and fourths, and then plot the data. Then problems 17 to 22 mix the tools in stories about cans, sports votes, cupcakes, and travel to school. Also, a separate answer key helps with checking, so a parent can grade quickly.
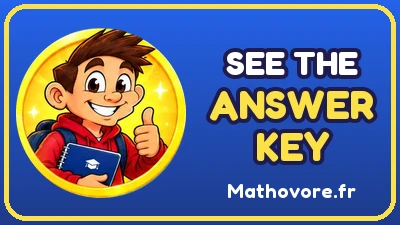
These 22 problems practice scaled picture graphs, scaled bar graphs, and line plots from standards 3.MD.B.3 and 3.MD.B.4. The first problems read the key and the scale, find how many more or how many fewer, and measure lengths on a ruler.
The later problems use line plots with halves and fourths of an inch and two-step graph questions about recycling, sports votes, and cupcakes. Write the unit in each answer.
Grade 3 Graphs Worksheet: problems 1–5
1. Read the key
Each circle stands for 2 pieces of fruit. How many peaches were sold?
2. Half circle
How many tickets were sold on Friday?
3. How many more
How many more stickers did Diego collect than Mei?
4. Total books
How many books did the four students read in all?
5. Make a picture graph
A table shows how many students chose each sport: Soccer 12, Tennis 8, Swimming 16, Baseball 10. Each circle will stand for 4 students. How many circles does each row need?
Grade 3 Graphs Worksheet: problems 6–10
6. Bar graph by twos
How many students have a fish?
7. Lunch votes
How many more students chose pizza than salad?
8. How many fewer
How many fewer students chose pink than green?
9. Going to school
How many students were asked in all?
10. Measure the crayon
Measure the length of the crayon to the nearest half inch.
Grade 3 Graphs Worksheet: problems 11–15
11. Measure the pencil
Measure the length of the pencil to the nearest fourth of an inch.
12. Measure the ribbon
Measure the length of the ribbon to the nearest fourth of an inch.
13. Seedling line plot
The line plot shows the heights of 8 seedlings. How many seedlings are \(2\frac{1}{2}\) inches tall?
14. Short pencils
How many pencils are shorter than 6 inches?
15. Make a line plot
Eight leaves have these lengths in inches: \(2\frac{1}{4}\), \(2\frac{3}{4}\), \(3\), \(2\frac{1}{2}\), \(3\), \(2\frac{3}{4}\), \(2\frac{3}{4}\), \(3\frac{1}{4}\). Draw a line plot with a number line from 2 to 4 marked in fourths. Which length is the most common?
Grade 3 Graphs Worksheet: problems 16–20
16. Longest and shortest
The line plot shows the lengths of 8 ribbons. How many inches longer is the longest ribbon than the shortest ribbon?
17. Recycling cans
How many cans were recycled on Monday and Thursday together? How many more is that than the cans recycled on Tuesday?
18. Sports votes
How many students voted in all? How many fewer students chose tennis than swimming?
19. Cupcake circles
In a picture graph, each circle stands for 6 cupcakes. Priya’s row has 4 whole circles and 1 half circle. Noah’s row has 2 whole circles. How many more cupcakes did Priya sell than Noah?
20. Craft sticks
Diego measured 9 craft sticks. How many craft sticks are 4 inches long or shorter?
Grade 3 Graphs Worksheet: problems 21–22
21. Graph paper squares
Each square of a bar graph stands for 5 votes. How many squares tall is a bar for 35 votes? How many votes does a bar 12 squares tall show?
22. Travel circles
Jamal asked how his classmates get to school: 25 walk, 15 bike, and 40 ride the bus. In a picture graph each circle will stand for 5 students. How many circles will he draw in all?
How do the picture graph problems work on this grade 3 graphs worksheet?
First, problem 1 says each circle stands for 2 pieces of fruit. Students count circles and then double, so the key does the work. Next, problem 2 adds a half circle on Friday, because tickets come in odd amounts. Then problem 5 reverses the task. A table lists soccer 12, tennis 8, swimming 16, and baseball 10, so students choose a key and draw the circles.
What do the bar graph and ruler problems ask?
Problem 7 compares pizza and salad votes, so students subtract. Meanwhile, problem 9 asks for the total, so students add every bar. After that, problems 10 to 12 switch to rulers. A crayon, a pencil, and a ribbon each need a length to the closest half or fourth inch. However, students must start at zero, because starting at the edge adds extra length.
How do the line plot problems finish the set?
Problem 13 counts seedlings that are \(2\frac{1}{2}\) inches tall. Then problem 15 gives eight leaf lengths, such as \(2\frac{1}{4}\) and \(2\frac{3}{4}\), so students build the plot. Finally, problem 16 subtracts the shortest ribbon from the longest. In problem 19, each circle stands for 6 cupcakes, so 4 whole circles and a half circle show 27. Problem 21 turns the idea around, because 35 votes need 7 squares at 5 votes each.
How should students work through this page?
First, underline the key or scale in every problem. Then write the unit next to each answer, since cans and inches are not the same. Afterward, check the answer key and redo any problem about halves, because that slip appears most often.

See every chapter on the Grade 3 math page.