


This grade 3 graphs lesson explains scaled graphs and line plots in one printable page, with definitions, a method and a worked example.
A scaled graph uses a key or a scale so one symbol or one square stands for more than one item. Picture graphs and bar graphs show data, and you read them to find how many more or fewer. A line plot shows measurements to the nearest half or fourth of an inch, with one X for each measurement.
Grade 3 Graphs Lesson: key facts
- In a scaled picture graph, the key tells how many items each symbol stands for.
- A half symbol stands for half of the number in the key.
- In a scaled bar graph, read the scale first; a bar can end between two labeled lines.
- To find how many more or fewer, subtract the two values; to find a total, add.
- A line plot puts one X above a measurement on a number line marked in halves or fourths of an inch.
What is a scaled picture graph?
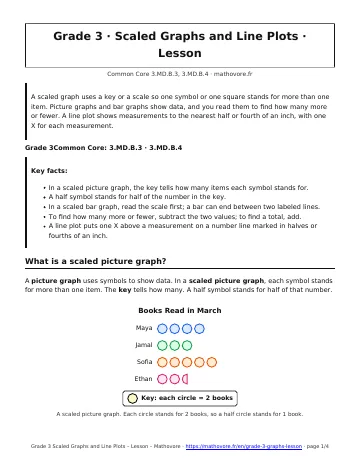
A picture graph uses symbols to show data. In a scaled picture graph, each symbol stands for more than one item. The key tells how many. A half symbol stands for half of that number.
Look at the key first. Each circle here is 2 books. Sofia has 5 circles: \(5 \times 2 = 10\) books. Ethan has 2 circles and a half circle: \(2 \times 2 = 4\) and \(4 + 1 = 5\) books.
How do you read a scaled bar graph?
A bar graph uses bars to compare categories. The scale is the set of numbers along the side. In this graph the labels count by 10, and the gray lines in between are 5 more. The Cats bar stops halfway between 10 and 20, so cats got 15 votes.
To compare, subtract the two bar values. Dogs got 25 and cats got 15, so dogs got \(25 – 15 = 10\) more votes. To find a total, add all the bars.
How do you measure to the nearest half or fourth of an inch?
Line up the left end of the object with the 0 mark on a ruler. Read where the right end stops. The longest marks are whole inches, the next marks are halves, and the shortest marks are fourths. Each inch has 4 fourths.
What is a line plot?
A line plot shows measurement data on a number line. Each X stands for one measurement, and X marks stack up above the same length.
- Draw a number line with ticks for every half inch or every fourth of an inch.
- Label the whole numbers and the fractions.
- Measure each object.
- Draw one X above its length for each object.
Example: In the leaf plot, 3 leaves are 3 inches long. The leaves longer than 3 inches are \(3\frac{1}{4}\) (1 leaf) and \(3\frac{1}{2}\) (2 leaves), so \(1 + 2 = 3\) leaves are longer than 3 inches.
| Graph | What each mark shows | What to check first |
|---|---|---|
| Picture graph | A symbol stands for several items | The key |
| Bar graph | The bar length shows the amount | The scale |
| Line plot | An X is one measurement | The tick marks |
Scaled Graphs and Line Plots: frequently asked questions
What is a scaled picture graph?
A scaled picture graph uses a symbol that stands for more than one item, such as 5 books. The key tells the number. A half symbol stands for half of that number.
How do you read a bar that ends between two numbers on the scale?
Find the halfway or in-between number. If the lines count by 10 and the bar stops halfway between 10 and 20, the bar shows 15. Always check what the small gray lines are worth.
How do you find how many more or how many fewer in a graph?
Read both values from the graph, then subtract the smaller from the larger. For bars of 25 and 15, there are 25 – 15 = 10 more in the longer bar.
How do you measure the length of an object with a ruler?
Put the left end of the object on the 0 mark and read the mark under the right end. Choose the nearest half or fourth of an inch. Each inch has 2 halves and 4 fourths.
What do the Xs on a line plot mean?
Each X is one measurement. Several Xs above the same mark mean several objects had that length. Count the Xs to find how many objects have a certain length.
How to use this grade 3 graphs lesson
Use this grade 3 graphs lesson before the worksheet, then check what you learned with the quiz.

See every chapter on the Grade 3 math page.