


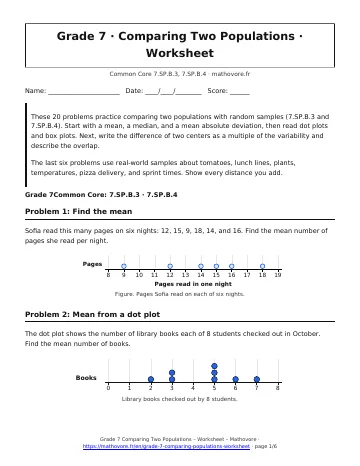
These 20 problems practice comparing two populations with random samples (7.SP.B.3 and 7.SP.B.4). Start with a mean, a median, and a mean absolute deviation, then read dot plots and box plots. Next, write the difference of two centers as a multiple of the variability and describe the overlap.
The last six problems use real-world samples about tomatoes, lunch lines, plants, temperatures, pizza delivery, and sprint times . Show every distance you add.
Problem 1: Find the mean
Sofia read this many pages on six nights: 12, 15, 9, 18, 14, and 16. Find the mean number of pages she read per night.
Problem 2: Mean from a dot plot
The dot plot shows the number of library books each of 8 students checked out in October. Find the mean number of books.
Problem 3: Find the MAD
Find the mean absolute deviation of the data 4, 6, 8, 10, 12, and 14.
Problem 4: MAD with a decimal
Find the mean absolute deviation of the data 3, 5, 6, 9, and 12. Write the MAD as a decimal.
Problem 5: Median and IQR
Jamal practiced the trumpet for these numbers of minutes on nine days: 12, 18, 6, 15, 9, 20, 11, 14, and 8. Find the median and the interquartile range (IQR).
Problem 6: Difference as a multiple
Two random samples of bean plants have mean heights of 9.5 inches and 6.5 inches. Both samples have a MAD of 1.5 inches. Write the difference of the means as a multiple of the MAD.
Problem 7: Compare two dot plots
The dot plots show the points scored by the Eagles and the Hawks in 8 games each. Find the mean and the MAD of each team. Then write the difference of the means as a multiple of the MAD.
Problem 8: Missing value from the mean
The mean of Ethan’s five quiz scores is 84. Four of the scores are 90, 78, 85, and 81. (a) Find the fifth score. (b) Find the MAD of all five scores.
Problem 9: Same mean, different MAD
Sofia and Diego each threw 8 darts at a board. The dot plots show the points scored on each dart.
- Find the mean and the MAD of each player.
- Write the difference of the means as a multiple of the MAD.
- Who is more consistent? Give the ratio of the larger MAD to the smaller MAD.
Problem 10: Compare box plots
The box plots show weekly practice time for samples of players from the Rockets and the Comets. Find each median and each IQR. Then write the difference of the medians as a multiple of the IQR.
Problem 11: Spread of two box plots
The box plots show unit test scores for random samples of students from Mr. Brown’s class and Ms. Lee’s class.
- Find the median and the IQR of each class.
- Which class has the greater variability? How many times as large is its IQR?
- Write the difference of the medians as a multiple of the larger IQR.
Problem 12: Work backward to the MAD
Two random samples of bus rides have mean ride times of 37 minutes and 51 minutes. Both samples have the same MAD, and the difference of the means is 3.5 times the MAD. (a) Find the MAD. (b) A third sample has a mean that is 2 MADs below the lower mean. Find the third mean.
Problem 13: Describe the overlap
The dot plots show the minutes needed to finish a puzzle in Class A and Class B. Find the mean and MAD of each class, and write the difference of the means as a multiple of the MAD. Then describe how much the two distributions overlap.
Problem 14: Two school samples
Mr. Ortiz surveyed a random sample of 10 students at each of two schools about their video game time on Saturday. Find the mean and MAD of each sample, write the difference of the means as a multiple of the MAD, and write one sentence comparing the two schools.
Problem 15: Cafeteria wait times
Aisha timed random samples of 10 students in two lunch lines. East line (minutes): 5, 5, 6, 6, 7, 7, 8, 8, 9, 9. West line (minutes): 9, 10, 11, 12, 13, 13, 14, 15, 16, 17. (a) Find the mean and MAD of each line. (b) Write the difference of the means as a multiple of the larger MAD. (c) Write one sentence comparing the two lines.
Problem 16: Tomato weights
Ethan weighed 8 tomatoes picked at random from Garden P: 5, 8, 8, 9, 9, 10, 11, and 12 ounces. Priya weighed 8 tomatoes from Garden Q: 3, 4, 5, 6, 6, 7, 7, and 10 ounces. Find the mean and MAD of each sample, and decide how many MADs apart the means are.
Problem 17: Fertilizer and plant height
Mei grew bean plants with two fertilizers and measured a random sample of 8 plants for each. Brand X heights (inches): 14, 15, 16, 17, 17, 18, 19, 20. Brand Y heights (inches): 17, 19, 20, 21, 22, 23, 24, 26. (a) Find the mean and MAD of each sample. (b) Write the difference of the means as a multiple of the larger MAD. (c) Which sample is more consistent?
Problem 18: July temperatures
A weather club recorded the high temperature on 10 randomly chosen July days. Tulsa: 79, 81, 84, 85, 86, 86, 87, 89, 91, and 92 °F. Portland: 73, 73, 74, 74, 76, 77, 77, 79, 83, and 84 °F. Compare the two cities using the mean and the MAD. Write how many MADs warmer the Tulsa mean is.
Problem 19: Pizza delivery times
Priya recorded delivery times , in minutes, for random samples of 9 orders from two pizza shops. Shop A: 18, 20, 22, 24, 25, 27, 29, 31, 35. Shop B: 27, 29, 31, 33, 34, 36, 38, 40, 47. (a) Find the median and IQR of each shop. (b) Write the difference of the medians as a multiple of the IQR. (c) Compare the two ranges. Does the range or the IQR describe the typical spread better here? Explain.
Problem 20: Sprint times
- A random sample of runners in Group A has a mean sprint time of 14.2 seconds and a MAD of 0.8 second. The mean of Group B is 1.5 MADs lower, and its MAD is also 0.8 second. Find the mean time of Group B.
- Liam says every runner in Group B must be faster than every runner in Group A. Explain why that may not be true.

See every chapter on the Grade 7 math page.