
Mathovore, everything you need to succeed in math: Common Core lessons, worksheets, tests and quizzes
Skip to content

Random Sampling and Making Inferences: Grade 7 Math Quiz – PDF Download

    Random Sampling and Making Inferences – Grade 7 math quiz

    Ten multiple-choice questions check populations and samples, random and biased sampling, and estimates from samples. Several questions include a diagram. Choose the one correct answer, then read the explanation to see the common mistake behind each wrong choice.

    Grade 7Common Core: 7.SP.A.1 · 7.SP.A.2
    🎯 Random Sampling and Making Inferences – Grade 7 math quiz
    Score: 0 / 10
    Answered: 0 / 10
    Question 1
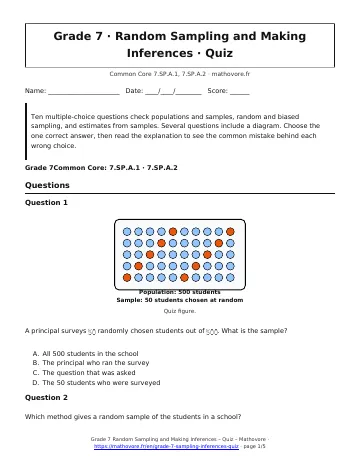
    Population: 500 studentsSample: 50 students chosen at random
    Quiz figure.

    A principal surveys \(50\) randomly chosen students out of \(500\). What is the sample?

    A All 500 students in the school
    B The principal who ran the survey
    C The question that was asked
    D The 50 students who were surveyed
    Question 2

    Which method gives a random sample of the students in a school?

    A Ask the first 30 students who arrive at practice
    B Draw 30 names from a hat holding every student's name
    C Survey the 30 members of the chess club
    D Ask 30 students who are leaving the gym
    Question 3

    A pizzeria asks 40 customers which topping they like best to find the favorite topping in the whole town. Why is the sample biased?

    A Forty is always too small to be random
    B The survey asked about toppings, not crusts
    C People who eat at a pizzeria may not represent the whole town
    D A survey must ask exactly 100 people
    Question 4
    20 of 50 students ride the bus
    Quiz figure.

    In a random sample of \(50\) students, \(20\) ride the bus. About how many of the \(800\) students ride the bus?

    A 320 students
    B 160 students
    C 400 students
    D 640 students
    Question 5

    Which sample is likely to give the most reliable estimate of the percent of students who like a new cafeteria menu?

    A 10 students chosen at random from the whole school
    B 20 students chosen at random from the whole school
    C 200 students chosen only from the band
    D 200 students chosen at random from the whole school
    Question 6
    81012141618202224Minutes of homework in a random sample
    Quiz figure.

    A random sample of \(5\) students reports their math homework time, in minutes. What is the sample mean?

    A 12 minutes
    B 22 minutes
    C 14 minutes
    D 70 minutes
    Question 7

    Three random samples of \(40\) students each from the same school give \(14\), \(18\), and \(16\) students who walk. Why do the results differ?

    A Random samples vary from one sample to the next
    B Someone must have counted wrong
    C The school changed between samples
    D Only the largest result is correct
    Question 8
    9 of 30 students own a bike
    Quiz figure.

    In a random sample of \(30\) students, \(9\) own a bike. About how many of \(1,500\) students own a bike?

    A 300 students
    B 270 students
    C 450 students
    D 500 students
    Question 9

    A random sample of \(50\) voters shows that \(36\) prefer a new library. What is the best estimate of the percent of all voters who prefer it?

    A About 36%
    B About 72%
    C About 14%
    D About 50%
    Question 10
    6789101112Students (out of 20) who like soccer
    Quiz figure.

    Four random samples of \(20\) students gave the counts shown who like soccer. What is the best estimate of the percent of all students who like soccer?

    A 45%
    B 40%
    C 50%
    D 36%

    🎉 Quiz complete!

    0 / 10

    Remember:

    • A population is the whole group; a sample is a part of it.
    • A random sample gives every member an equal chance of selection.
    • Biased samples favor some members and lead to unreliable inferences.
    • Estimate a population count: sample proportion times population size.
    • Different random samples vary; larger samples vary less.
    See every chapter on the Grade 7 math page.

    Voter... post

    More Grade 7 math

    Proportional Relationships

    Adding and Subtracting Integers and Rational Numbers

    Percent Increase, Percent Decrease and Percent Error

    Comparing Two Populations

    Probability of Compound Events

    Probability and Probability Models