



This worksheet has twenty problems on random sampling and inference, aligned with Common Core standards 7.SP.A.1 and 7.SP.A.2. The first problems practice naming populations and samples and spotting biased methods. The middle problems use a sample proportion or a sample mean to estimate a population.
The last problems compare several samples and ask how sample size changes reliability. Write each estimate with the word about, since an estimate is not exact.
Problem 1: Population and sample
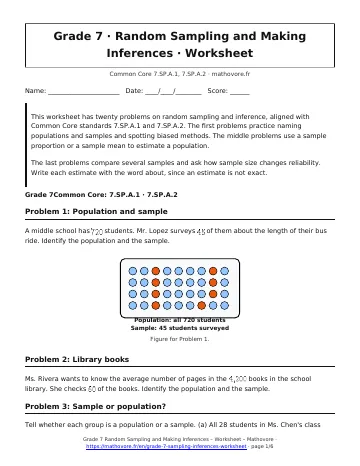
A middle school has \(720\) students. Mr. Lopez surveys \(45\) of them about the length of their bus ride. Identify the population and the sample.
Problem 2: Library books
Ms. Rivera wants to know the average number of pages in the \(4,200\) books in the school library. She checks \(60\) of the books. Identify the population and the sample.
Problem 3: Sample or population?
Tell whether each group is a population or a sample. (a) All 28 students in Ms. Chen’s class when she wants the class average on a quiz. (b) 30 shoppers asked at a farmers market about the price of apples in the whole town. (c) Every one of the 1,200 library books when counting damaged books.
Problem 4: Random or not random
Maya wants to survey \(30\) of the \(480\) students about their favorite lunch. Tell whether each method gives a random sample. (a) Write all 480 names on slips, mix them in a hat, and draw 30. (b) Ask the first 30 students in the lunch line. (c) Ask 30 members of the cooking club.
Problem 5: Which sample is better?
Ethan wants to estimate which season the \(600\) students at his school like best. Method A: ask \(40\) members of the soccer team. Method B: number the roster from \(1\) to \(600\) and use a random number generator to choose \(40\) numbers. Which method is more likely to give a sample that represents all students? Explain.
Problem 6: Explain the bias
Diego wants to know which sport students in his town like best. He surveys \(25\) fans leaving a Little League game. Explain why the sample is biased.
Problem 7: Bus stop survey
Aisha wants to know whether adults in her town support a new bus line. She surveys \(50\) people waiting at a bus stop. Explain why the sample is biased, and describe one way to improve it.
Problem 8: Estimate a population count
In a random sample of \(40\) students, \(14\) walk to school. Estimate how many of the \(600\) students at the school walk.
Problem 9: Reusable bags
In a random sample of \(50\) shoppers at a grocery store, \(20\) bring reusable bags. Estimate how many of the \(1,500\) shoppers who visit the store in a week bring reusable bags.
Problem 10: Estimate a mean
Priya measures the heights of \(10\) randomly chosen sunflowers in a large garden, in centimeters: \(142, 150, 138, 155, 147, 149, 151, 144, 146, 148\). Estimate the mean height of all the sunflowers in the garden.
Problem 11: Voter survey
A random sample of \(80\) voters in a town of \(2,500\) voters is asked about a new library. Of those asked, \(52\) favor it. Estimate the percent of all voters who favor the library and the number of voters who favor it.
Problem 12: Homework time
Mei asks \(8\) randomly chosen students from her school of \(640\) students how many minutes of homework they did last night. The answers are \(36, 42, 28, 50, 45, 38, 40, 41\). Estimate the mean number of minutes for all students. Then estimate the total minutes of homework the whole school did.
Problem 13: Two samples, two estimates
Two random samples of \(30\) students each were asked if they prefer a later start time. Sample A: \(12\) said yes. Sample B: \(15\) said yes. For \(900\) students, estimate the number who prefer a later start from each sample. Explain why the estimates differ.
Problem 14: Quality control
A factory checks a random sample of \(50\) light bulbs from a shipment of \(4,000\) bulbs and finds \(3\) defective. Estimate how many bulbs in the shipment are defective.
Problem 15: Sample size
The school has \(1,200\) students. Liam asks \(10\) random students about a school dance: \(7\) say yes. Aisha asks \(100\) random students: \(58\) say yes. Estimate the number of students who want the dance from each sample, then tell which estimate is likely more reliable and why.
Problem 16: Does most mean most?
Noah claims that most of the \(800\) students at his school prefer pizza for lunch. A random sample of \(30\) students has \(17\) who prefer pizza. A second random sample of \(30\) students has \(13\). (a) Estimate the number of students who prefer pizza from each sample, rounded to the nearest whole number. (b) Decide whether either sample proves Noah is right. (c) Combine the two samples and give a better estimate.
Problem 17: Five samples of lunch buyers
Noah takes five random samples of \(20\) students each from a school with \(1,200\) students and counts how many buy lunch: \(9, 11, 8, 12, 10\). (a) Find the mean count. (b) Use it to estimate how many students at the school buy lunch. (c) Use the smallest and the largest counts to give a range of estimates.
Problem 18: Burnt cookies
An inspector chooses \(80\) cookies at random from a batch of \(2,400\) cookies and finds \(6\) that are burnt. Estimate how many cookies in the batch are burnt. If each burnt cookie costs the bakery $0.75, estimate the total loss.
Problem 19: Bass in the pond
A pond holds about \(1,250\) fish. A ranger catches a random sample of \(50\) fish and finds \(9\) bass. A second random sample of \(100\) fish has \(20\) bass. Estimate the number of bass in the pond from each sample. Which estimate is likely more reliable, and why?
Problem 20: New park vote
A town has \(12,000\) residents. A random sample of \(150\) residents is asked about a new park, and \(96\) say yes. Four more random samples of \(150\) residents give \(90, 99, 93\) and \(107\) yes answers. (a) Estimate the number of residents in favor from the first sample. (b) Find the mean of all five counts and use it to estimate again. (c) Use the smallest and largest counts to give a range of estimates.

See every chapter on the Grade 7 math page.