


A sample is part of a population, and a random sample gives every member an equal chance of being chosen. A biased sample favors some members and gives misleading results. To estimate a population, find the proportion or mean in a random sample and apply it to the whole group. Different samples vary a little.
Key facts:
- A population is the whole group; a sample is a part of it.
- A random sample gives every member an equal chance of selection.
- Biased samples favor some members and lead to unreliable inferences.
- Estimate a population count: sample proportion times population size.
- Different random samples vary; larger samples vary less.
What are a population and a sample?
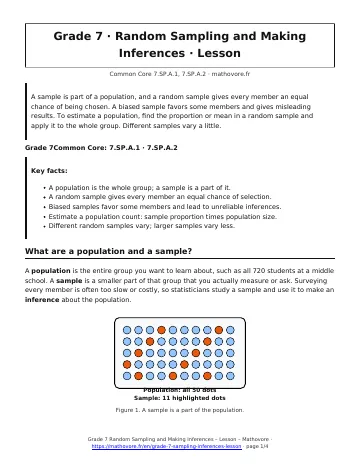
A population is the entire group you want to learn about, such as all 720 students at a middle school. A sample is a smaller part of that group that you actually measure or ask. Surveying every member is often too slow or costly, so statisticians study a sample and use it to make an inference about the population.
What makes a sample random or biased?
In a random sample, every member of the population has an equal chance of being chosen. A biased sample favors some members, so it does not represent the population.
Drawing names from a hat is random. Asking only the players on the basketball team about their favorite sport is biased, because those students are not typical of the whole school. Random samples tend to be representative, so they support valid inferences.
How do you use a sample to estimate a population?
Find the sample proportion or the sample mean, then apply it to the whole population.
- Count how many in the sample have the trait, and divide by the sample size.
- Multiply that proportion by the population size.
- Round sensibly and say the answer is an estimate.
Worked example. In a random sample of \(40\) students, \(14\) walk to school. The proportion is \(\frac{14}{40}=0.35\). For a school of \(600\) students, the estimate is \(0.35\times 600=210\) walkers.
Why do different samples give different results?
Two random samples from the same population almost never match exactly. This is sampling variation. In Figure 4, five random samples of \(20\) students each gave counts between \(8\) and \(12\) who buy lunch. Larger samples vary less, so they usually give better estimates.
Random Sampling and Making Inferences: frequently asked questions
What is the difference between a population and a sample?
A population is every member of the group you want to know about. A sample is a smaller group taken from it. For example, all 900 students at a school form a population, and 60 students picked by lottery form a sample.
How can you tell if a sample is biased?
Ask whether every member of the population had an equal chance of being chosen. If the sample came from one place, one club, or only volunteers, some members were favored. That makes the sample biased.
Why do we use random samples?
A random sample is likely to look like the population, so it supports valid inferences. Chance, not personal choice, decides who is included. Drawing names from a hat or using a random number generator are fair methods.
Why do two samples of the same size give different answers?
Each random sample contains different people, so the results change a little. That is called sampling variation. If one sample shows 40% and another shows 50%, both can still be good estimates.
Does a bigger sample give a better estimate?
Usually yes, if the sample is random. Larger random samples vary less from one sample to the next. A sample of 100 students is more reliable than a sample of 10 students.
See every chapter on the Grade 7 math page.