This grade 8 two worksheet answer key solves all 22 problems of the two-way tables worksheet step by step.
This answer key shows every step for the 22 worksheet problems on two-way tables. Check which total each percent uses, and compare your table and conclusion with the worked solutions and completed tables.
Grade 8 Two Worksheet Answer Key: problems 1–5
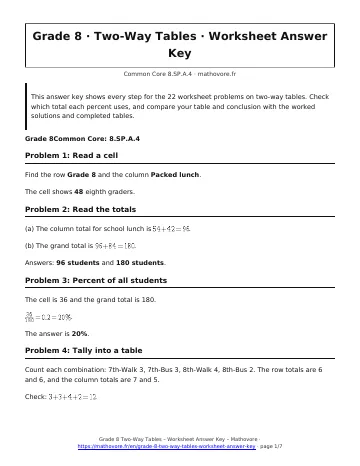
Problem 1: Read a cell
Find the row Grade 8 and the column Packed lunch.
The cell shows 48 eighth graders.
Problem 2: Read the totals
(a) The column total for school lunch is \(54+42=96\).
(b) The grand total is \(96+84=180\).
Answers: 96 students and 180 students.
Problem 3: Percent of all students
The cell is 36 and the grand total is 180.
\(\frac{36}{180}=0.2=20\%\).
The answer is 20%.
Problem 4: Tally into a table
Count each combination: 7th-Walk 3, 7th-Bus 3, 8th-Walk 4, 8th-Bus 2. The row totals are 6 and 6, and the column totals are 7 and 5.
Check: \(3+3+4+2=12\).
Problem 5: Complete the table
Row 1: \(31-14=17\) eighth graders are in band.
Column 1: \(50-14=36\) seventh graders are not in band.
Check with column 2: \(17+33=50\).
Grade 8 Two Worksheet Answer Key: problems 6–10
Problem 6: Percent within a row
Divide by the Grade 7 row total, 90: \(\frac{36}{90}=0.4=40\%\).
The answer is 40%.
Problem 7: Another row percent
Divide by the Grade 8 row total, 90: \(\frac{42}{90}\approx 0.467\).
The answer is 46.7%.
Problem 8: Percent within a column
Divide by the packed-lunch column total, 84: \(\frac{48}{84}\approx 0.571\).
The answer is 57.1%.
Problem 9: Row relative frequencies
Girls: \(\frac{36}{60}=60\%\) and \(\frac{24}{60}=40\%\).
Boys: \(\frac{24}{60}=40\%\) and \(\frac{36}{60}=60\%\).
Problem 10: Is there an association?
Of girls, 60% read daily. Of boys, only 40% read daily. The percents are noticeably different.
Yes, there is a possible association: girls in this survey are more likely to read daily.
Grade 8 Two Worksheet Answer Key: problems 11–15
Problem 11: No association
Grade 7: \(\frac{24}{40}=60\%\) chose pizza.
Grade 8: \(\frac{36}{60}=60\%\) chose pizza.
The percents are equal, so there is no association. The counts differ only because the groups have different sizes.
Problem 12: Read the bar graph
Grade 7 packs a lunch 40% of the time. Grade 8 packs a lunch 53.3% of the time.
Eighth graders pack a lunch more often, and the 13-point difference suggests a possible association between grade and lunch type.
Problem 13: Build from percents
Non-sport players: \(200-120=80\).
Sport and club: \(0.45\times 120=54\), so sport and no club: \(120-54=66\).
No sport and club: \(0.25\times 80=20\), so no sport and no club: \(80-20=60\).
Problem 14: Row or column total?
(a) The group is girls, so divide by the girls row total, 40: \(\frac{13}{40}=32.5\%\).
(b) The group is bowling fans, so divide by the bowling column total, 35: \(\frac{13}{35}\approx 37.1\%\).
Answers: 32.5% and 37.1%.
Problem 15: Overall percent
The total who own a tablet is \(45+27=72\).
\(\frac{72}{180}=0.4=40\%\).
The answer is 40%.
Grade 8 Two Worksheet Answer Key: problems 16–20
Problem 16: Farmers market survey
Under 30: \(\frac{27}{60}=45\%\) buy organic.
30 and over: \(\frac{54}{90}=60\%\) buy organic.
The 15-point difference suggests a possible association: shoppers 30 and over are more likely to buy organic produce.
Problem 17: Movie snacks
Table totals: row totals 60 and 70, column totals 82 and 48, grand total 130.
Under 13: \(\frac{33}{60}=55\%\). Ages 13 and over: \(\frac{49}{70}=70\%\).
The percents differ by 15 points, so there is a possible association: older moviegoers are more likely to buy popcorn.
Problem 18: Sleep and test scores
8 or more hours: \(\frac{21}{30}=70\%\) earned an A, and 9 did not.
Less than 8 hours: \(\frac{12}{30}=40\%\) earned an A, and 18 did not.
Column totals: \(21+12=33\) earned an A and \(9+18=27\) did not.
There is a possible association: students who slept more were more likely to earn an A.
Problem 19: Pets in the class
Boys: \(35-15=20\), so 8 boys have no pet. Girls: 9 have a pet, so 6 do not.
Girls: \(\frac{9}{15}=60\%\). Boys: \(\frac{12}{20}=60\%\).
The percents are equal, so there is no association between gender and owning a pet in this class.
Problem 20: Little League practice
No hit: \(50-30=20\) and \(30-12=18\). Column totals: 42 and 38.
3 or more days: \(\frac{30}{50}=60\%\) got a hit. Fewer days: \(\frac{12}{30}=40\%\) got a hit.
The 20-point gap shows a possible association: players who practiced more got hits more often.
Grade 8 Two Worksheet Answer Key: problems 21–22
Problem 21: Table from column percents
Walkers: 35 are in 7th grade, so 65 are in 8th. Bus riders: \(0.5\times 60=30\) are in 7th grade, so 30 are in 8th.
Seventh graders total \(35+30=65\).
\(\frac{35}{65}\approx 0.538\), so about 53.8% of seventh graders walk.
Problem 22: Check the claim
Girls who like math: \(\frac{49}{100}=49\%\).
Boys who like math: \(\frac{31}{50}=62\%\).
The claim is wrong. There are more girls in the survey, so there are more girls who like math. A larger share of boys (62%) than girls (49%) like math.
How to use this grade 8 two worksheet answer key
Read this grade 8 two worksheet answer key after trying each problem yourself, and redo any problem you missed.

See every chapter on the Grade 8 math page.