


These 22 problems practice Common Core standard 8.SP.A.4. Read and complete two-way frequency tables, find relative frequencies by row or by column, and use the percents to decide whether two categorical variables seem to be associated.
The last six problems are survey word problems that ask for a table, the percents and a conclusion. Work from easiest to hardest.
Problem 1: Read a cell
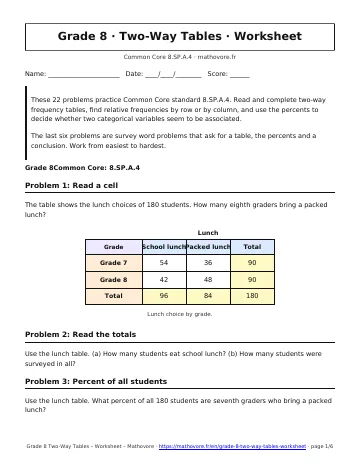
The table shows the lunch choices of 180 students. How many eighth graders bring a packed lunch?
Problem 2: Read the totals
Use the lunch table. (a) How many students eat school lunch? (b) How many students were surveyed in all?
Problem 3: Percent of all students
Use the lunch table. What percent of all 180 students are seventh graders who bring a packed lunch?
Problem 4: Tally into a table
Twelve students were asked their grade and how they get to school. The responses are: 7th-Walk, 8th-Bus, 8th-Walk, 7th-Bus, 8th-Walk, 7th-Walk, 8th-Bus, 7th-Bus, 8th-Walk, 7th-Walk, 7th-Bus, 8th-Walk. Organize the data in a two-way table with row and column totals.
Problem 5: Complete the table
A survey of 100 students asked about band and grade level. Find the missing entries.
Problem 6: Percent within a row
Use the lunch table. What percent of seventh graders bring a packed lunch?
Problem 7: Another row percent
Use the lunch table. What percent of eighth graders eat school lunch? Round to the nearest tenth of a percent.
Problem 8: Percent within a column
Use the lunch table. Of the students who bring a packed lunch, what percent are eighth graders? Round to the nearest tenth of a percent.
Problem 9: Row relative frequencies
Of 120 eighth graders, the table shows who reads for fun every day. Make a table of row relative frequencies (percents of each row).
Problem 10: Is there an association?
Use the reading table. Do the data suggest an association between group and daily reading? Explain.
Problem 11: No association
Eighth graders were asked to pick pizza or tacos for a class party. Decide whether grade and choice are associated.
Problem 12: Read the bar graph
The stacked bars show the percent of seventh graders and eighth graders who pack a lunch. Which group packs a lunch more often? Does the graph suggest an association?
Problem 13: Build from percents
In a survey of 200 students, 120 play a sport. Of the 120 sport players, 45% belong to a club. Of the students who do not play a sport, 25% belong to a club. Make a two-way table of sport and club membership, with totals.
Problem 14: Row or column total?
A group of 80 students chose a weekend activity. (a) What percent of the girls chose bowling? (b) What percent of the students who chose bowling are girls? Explain which total you divide by each time.
Problem 15: Overall percent
The table shows tablet ownership in two grades. What percent of all 180 students own a tablet?
Problem 16: Farmers market survey
Sofia asked 150 shoppers at a farmers market whether they buy organic produce. Compare the two age groups with relative frequencies and describe any association.
Problem 17: Movie snacks
A theater counted whether moviegoers bought popcorn. Under 13: 33 bought popcorn and 27 did not. Ages 13 and over: 49 bought popcorn and 21 did not. Make a table, find the row percents, and decide whether age and popcorn purchases appear to be associated.
Problem 18: Sleep and test scores
Thirty students slept 8 or more hours and 30 slept less than 8 hours before a test. Of the first group, 21 earned an A. Of the second group, 12 earned an A. Make a two-way table, find the percent earning an A in each group, and describe the association.
Problem 19: Pets in the class
In Mei’s class of 35 students, 15 are girls. Nine of the girls own a pet, and 12 of the boys own a pet. Make a two-way table of gender and pet ownership. Is there an association?
Problem 20: Little League practice
A coach tracked 80 players. Among the 50 players who practiced 3 or more days a week, 30 got a hit in the championship game. Among the 30 players who practiced fewer days, 12 got a hit. Make a table with totals, find the row percents, and describe any association.
Problem 21: Table from column percents
Of the 100 students who walk to school, 35% are seventh graders. Of the 60 students who ride the bus, 50% are seventh graders. Make a two-way table. Then find the percent of all seventh graders who walk, to the nearest tenth of a percent.
Problem 22: Check the claim
Diego says, “Of the 80 students who like math, 49 are girls and only 31 are boys, so girls like math more than boys do.” The survey had 100 girls and 50 boys. Use relative frequencies to evaluate the claim.

See every chapter on the Grade 8 math page.