



The graphs of sine and cosine are smooth waves that repeat every \(2\pi\) and stay between \(-1\) and \(1\). In \(y=A\sin(B(x-C))+D\), the amplitude is \(|A|\), the period is \(\frac{2\pi}{B}\), the phase shift is \(C\), and the midline is \(y=D\). These four numbers let you graph any sinusoid and model periodic situations.
Key facts:
- Standards F-TF.B.5 and F-IF.C.7e: graph sine and cosine and use them to model periodic phenomena.
- Parent functions have amplitude \(1\), period \(2\pi\), midline \(y=0\) and range \([-1,1]\).
- Period is \(\frac{2\pi}{B}\): a larger \(B\) squeezes the wave horizontally.
- Maximum \(=D+|A|\) and minimum \(=D-|A|\), so \(D=\frac{\max+\min}{2}\).
- To model a situation, match the radius or half-range to \(A\), the center to \(D\) and the time per cycle to the period.
What do the graphs of sine and cosine look like?
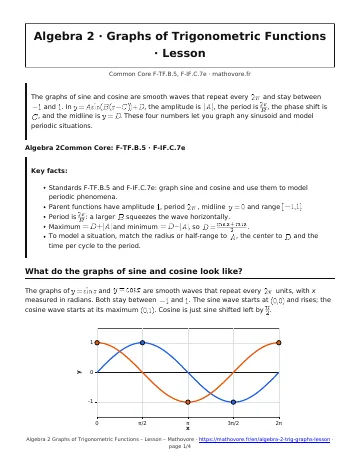
The graphs of \(y=\sin x\) and \(y=\cos x\) are smooth waves that repeat every \(2\pi\) units, with x measured in radians. Both stay between \(-1\) and \(1\). The sine wave starts at \((0,0)\) and rises; the cosine wave starts at its maximum \((0,1)\). Cosine is just sine shifted left by \(\frac{\pi}{2}\).
What do A, B, C and D change?
Every sinusoid can be written \(y=A\sin(B(x-C))+D\), or with cosine in place of sine. Each letter transforms the parent graph in one way.
| Letter | Feature | How to find it |
|---|---|---|
| \(A\) | Amplitude | \(|A|\); a negative \(A\) flips the wave |
| \(B\) | Period | \(\frac{2\pi}{B}\) for \(B > 0\) |
| \(C\) | Phase shift | Right by \(C\) if \(C > 0\), left if \(C\) is negative |
| \(D\) | Midline | The horizontal line \(y=D\) |
Amplitude: half the distance from the maximum to the minimum.
Period: the length of one complete cycle.
Midline: the horizontal line halfway between the maximum and minimum.
Phase shift: the horizontal shift of the starting point of the cycle.
How do you graph a sinusoid step by step?
Example: graph \(y=2\sin(x-\frac{\pi}{3})+1\).
- Read the features: amplitude \(2\), period \(2\pi\), phase shift \(\frac{\pi}{3}\) to the right, midline \(y=1\).
- Draw the dashed midline \(y=1\). The maximum is \(1+2=3\) and the minimum is \(1-2=-1\).
- Start the cycle at \((\frac{\pi}{3},1)\). Quarter-period steps of \(\frac{\pi}{2}\) give the maximum at \(x=\frac{5\pi}{6}\), the midline at \(\frac{4\pi}{3}\), and the minimum at \(\frac{11\pi}{6}\).
- Join the points with a smooth wave and continue it as far as the domain requires.
How do sinusoids model real situations?
Anything that repeats at a steady rate, such as tides, daylight hours or a Ferris wheel, can be modeled by a sinusoid. A wheel with radius \(20\text{ ft}\), center \(25\text{ ft}\) above the ground and one turn every \(30\) seconds has height \(h(t)=25-20\cos(\frac{2\pi t}{30})\). The amplitude is the radius, the midline is the center height, and the period is the time for one turn. A reflected cosine starts at the minimum, which is where a rider boards.
Graphs of Trigonometric Functions: frequently asked questions
What is the difference between the graphs of sine and cosine?
They have the same shape. Cosine starts at its maximum \((0,1)\), while sine starts at the midline \((0,0)\). Shifting the sine graph left \(\frac{\pi}{2}\) produces the cosine graph.
How do you find the amplitude of a sinusoid?
Take half the distance between the maximum and the minimum, or read \(|A|\) from the equation. For a graph with maximum \(7\) and minimum \(-3\), the amplitude is \(\frac{7-(-3)}{2}=5\).
How do you find the period from the equation?
Use \(\text{period}=\frac{2\pi}{B}\) with \(B > 0\). For \(y=\cos(4x)\) the period is \(\frac{2\pi}{4}=\frac{\pi}{2}\). If \(B\) is a fraction like \(\frac{1}{2}\), the period is longer: \(4\pi\).
What does a negative A do to the graph?
A negative \(A\) reflects the wave across its midline. The amplitude is still \(|A|\), but a sine wave now falls first, and a cosine wave starts at its minimum instead of its maximum.
Why use cosine for a Ferris wheel model?
A rider boards at the lowest point, so a reflected cosine such as \(25-20\cos(Bt)\) starts at the minimum when \(t=0\). Any starting position can also be modeled with sine and a phase shift.
See every chapter on the Algebra 2 math page.