
Key takeaway: This algebra 2 normal distribution lesson shows how mean and standard deviation describe a bell-shaped data set, how a z-score places a value on that curve and how study design limits what you may conclude. It follows standards S-ID.A.4, S-IC.A.1, S-IC.B.3 and S-IC.B.4. First, you measure center and spread. Next, you apply the empirical rule with its 68, 95 and 99.7 percents. Finally, you use simulation to judge the margin of error in a poll.
The mean and standard deviation summarize the center and spread of a data set. In a normal distribution, about 68%, 95% and 99.7% of values lie within 1, 2 and 3 standard deviations of the mean, and a z-score counts how many standard deviations a value sits from the mean. Random sampling and random assignment make surveys and experiments trustworthy.
Algebra 2 Normal Distribution Lesson: key facts
- Standards S-ID.A.4, S-IC.A.1, S-IC.B.3 and S-IC.B.4: normal models, z-scores, study design and margin of error.
- Normal data follow the 68-95-99.7 rule: \(68\%\), \(95\%\) and \(99.7\%\) within 1, 2 and 3 standard deviations.
- The z-score is \(z=\frac{x-\mu}{\sigma}\); the table gives the area to the left of \(z\).
- Only an experiment with random assignment can support a cause-and-effect conclusion.
- A margin of error can be estimated as half the width of the middle \(95\%\) of simulated sample results.
What are the mean and standard deviation of a data set?
The mean \(\overline{x}\) is the sum of the values divided by how many there are. The standard deviation \(\sigma\) measures the typical distance of the values from the mean.
Calculators often report the sample version, which divides by \(n-1\). This page divides by \(n\).
Example. Five students read 2, 4, 5, 6 and 8 books. The mean is \(\frac{25}{5}=5\). The deviations \(x-\overline{x}\) are \(-3,-1,0,1,3\), their squares sum to \(20\), and \(\sigma=\sqrt{\frac{20}{5}}=2\). Adding a constant to every value shifts the mean but leaves \(\sigma\) alone; multiplying every value by \(k\) multiplies both by \(k\) (for \(k > 0\)).
What is the 68-95-99.7 rule for a normal distribution?
A normal distribution is a symmetric bell-shaped curve centered at the mean \(\mu\) with spread \(\sigma\). About \(68\%\) of values fall within \(1\) standard deviation of the mean, \(95\%\) within \(2\), and \(99.7\%\) within \(3\).
If youth-league heights have \(\mu=70\) in and \(\sigma=3\) in, then about \(95\%\) of players are between 64 in and 76 in tall, and about \(2.5\%\) are taller than 76 in.
How do you use a z-score?
\[z=\frac{x-\mu}{\sigma}\]The z-score counts how many standard deviations a value lies above (positive) or below (negative) the mean.
- Subtract the mean from the value.
- Divide by the standard deviation.
- Read the sign and size of \(z\).
- Use a table or calculator to find the area to the left of \(z\).
Example. Maya scores 82 on a test with \(\mu=70\) and \(\sigma=8\). Then \(z=\frac{82-70}{8}=1.5\). A table gives an area of \(0.9332\) to the left, so her score is at about the 93rd percentile.
How do surveys, experiments and observational studies differ?
A sample survey asks a random sample so that results describe the whole population. An observational study records groups as they already are, so it shows association only. An experiment uses random assignment of treatments, which balances other factors and supports cause-and-effect claims. Convenience samples, such as the first 50 students through a door, are biased.
How does simulation give a margin of error?
Suppose a school is truly \(60\%\) in favor of a later start time. Simulate 200 random samples of 100 students and record each sample percent. The middle \(95\%\) of results run from \(49\%\) to \(70\%\), about \(10.5\) points on either side of 60. So a poll of 100 students has a margin of error of about 10 percentage points. Quadrupling the sample size roughly halves it.
Data, Normal Distributions and Statistical Inference: frequently asked questions
What does a z-score tell you?
A z-score tells how many standard deviations a value is above or below the mean. A z-score of \(-2\) means the value is two standard deviations below average. It lets you compare values from different data sets.
What is the 68-95-99.7 rule?
For approximately normal data, about \(68\%\) of values lie within one standard deviation of the mean, \(95\%\) within two, and \(99.7\%\) within three. It gives quick estimates without a table.
What is the difference between an experiment and an observational study?
In an experiment, researchers randomly assign the treatments. In an observational study, they only record what happens in groups that formed on their own. Only the experiment can show that a treatment causes a change.
What is the difference between random sampling and random assignment?
Random sampling chooses who is in the study so the results can be generalized to a population. Random assignment decides which participants get which treatment so the groups are comparable. A good study can use both.
How do you estimate a margin of error from a simulation?
Simulate many random samples of the same size from a population with a known percent. Find the middle \(95\%\) of the sample percents, then take half of the distance from the lowest to the highest of them.
How do mean and standard deviation describe a data set?
The mean locates the center, while the standard deviation measures typical distance from it. For 2, 4, 4, 4, 5, 5, 7 and 9, the mean is 5 and the squared distances average 4, so the deviation is 2. Adding a constant shifts the mean but leaves the spread alone. Scaling every value, however, scales both.
What does the empirical rule say about a bell curve?
For bell-shaped data, roughly 68% of values sit within one deviation of the center. Two deviations capture about 95%, and three capture nearly everything, 99.7%. Suppose scores have mean 100 and standard deviation 15. Then roughly 95% of scores lie between 70 and 130. A score of 145 sits three deviations out, so it is rare.
How do you use a z-score?
Compute \(z=\frac{x-\mu}{\sigma}\). A package that takes 41 minutes when the mean is 50 and the deviation is 4.5 has \(z=-2\). That means it arrived two deviations early. Because z-scores share one scale, they let you compare a math score with a science score fairly.
Why does random assignment matter?
A sample survey needs random selection, and an experiment needs random assignment. Only the experiment can justify saying one variable caused a change in the other. For a poll, simulate many samples and take half the width of the middle 95% to estimate the margin of error.
What should come after this lesson?
Work the clinic wait-time and rice-bag problems, since they pair intervals with real units. Then label three news claims as sample survey, observational study or experiment. By doing both, you connect the curve to the story behind the data.

Printable PDF · Lesson
Algebra 2 Data, Normal Distributions and Statistical Inference lesson
Download the PDF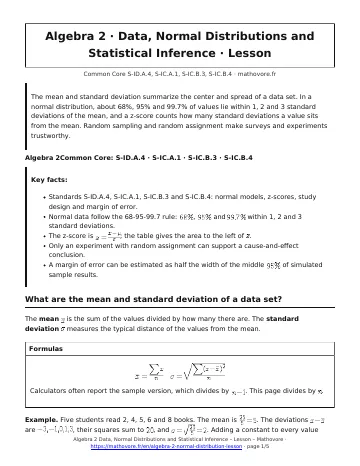
- Data, Normal Distributions and Statistical Inference worksheet (22 problems)
- Data, Normal Distributions and Statistical Inference quiz (10 questions)
- Data, Normal Distributions and Statistical Inference test (45 minutes)
- Previous lesson: Probability: Sample Spaces, Independence and Conditional Probability
- Next lesson: Structure of Expressions and Modeling with Equations
See every chapter on the Algebra 2 math page.