This algebra 1 correlation regression quiz asks 10 multiple-choice questions on two-way tables, scatter plots and correlation, and each answer comes with a short explanation.
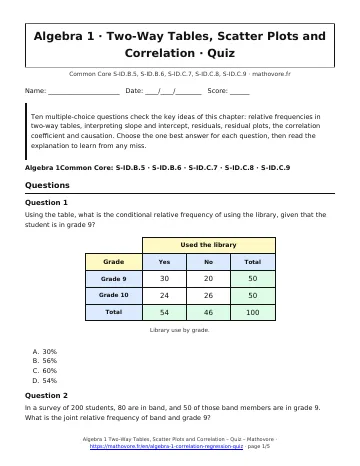
Ten multiple-choice questions check the key ideas of this chapter: relative frequencies in two-way tables, interpreting slope and intercept, residuals, residual plots, the correlation coefficient and causation. Choose the one best answer for each question, then read the explanation to learn from any miss.
🎯 Two-Way Tables, Scatter Plots and Correlation – Algebra 1 math quiz
Score: 0 / 10
Answered: 0 / 10
Question 1
Using the table, what is the conditional relative frequency of using the library, given that the student is in grade 9?Library use by grade.
A30%
B56%
C60%
D54%
Question 2
In a survey of 200 students, 80 are in band, and 50 of those band members are in grade 9. What is the joint relative frequency of band and grade 9?
A62.5%
B40%
C37.5%
D25%
Question 3
The line \(y=2.4x+31\) models a child's predicted height \(y\) in inches at age \(x\) years for ages 3 to 8. What does the slope 2.4 mean?
APredicted height at age 0 is 2.4 inches
BThe average child is 2.4 years old
CPredicted height rises about 2.4 inches per year of age
DHeight and age have a correlation of 2.4
Question 4
The scatter plot compares days absent with homework points. Which statement describes the association?Homework points and absences.
ANegative and strong
BPositive and strong
CNegative and weak
DNo association
Question 5
A line predicts a quiz score of 62 for a student, but the student actually scores 70. What is the residual?
A-8
B8
C132
D66
Question 6
The line \(y=6.5x+40\) models typing speed \(y\) in words per minute after \(x\) weeks of practice (0 to 10 weeks). What does the y-intercept 40 mean?
ASpeed rises 40 wpm each week
BPredicted speed before any practice is 40 wpm
CStudents practice for 40 weeks
DSpeed rises 6.5 wpm at the start
Question 7
The residual plot comes from a linear model. What does it show?Residuals of a linear model.
AA line is a good fit because residuals are small
BThe slope of the line is zero
CA line is a poor fit because the residuals form a U shape
DThe data have no correlation at all
Question 8
Which value is the best estimate of the correlation coefficient for this scatter plot?Score and practice.
A\(r=-0.95\)
B\(r=0.95\)
C\(r=0.35\)
D\(r=0.05\)
Question 9
Which correlation coefficient shows the strongest linear relationship?
A\(r=-0.91\)
B\(r=0.85\)
C\(r=-0.50\)
D\(r=0.30\)
Question 10
A town finds a strong positive correlation between monthly ice cream sales and monthly pool visits. Which conclusion is best supported?
AEating ice cream causes people to go swimming
BSwimming causes ice cream sales to rise
CPool visits cause the weather to warm up
DHot weather may raise both, so a lurking variable is likely
🎉 Quiz complete!
0 / 10
How does this quiz work?
Read each question, choose one answer among A, B, C and D, then check it: a short explanation appears after every answer. Your score out of 10 is shown at the end, and you can restart the quiz as often as you like.
What should you review before the quiz?
Reread the key facts of the lesson and the worked example. If a question is hard, go back to the matching part of the lesson, then try the quiz again. Write your work on scrap paper: most mistakes come from skipping a step, not from the idea itself.
Remember:
Joint, marginal and conditional relative frequencies come from a two-way table and are found by dividing by a grand total or by a row or column total.
A residual equals the actual value minus the predicted value; a random residual plot means a line fits well.
In \(y=mx+b\), the slope is the predicted change in \(y\) per 1-unit change in \(x\), and the y-intercept is the predicted \(y\) when \(x=0\).
The correlation coefficient \(r\) ranges from \(-1\) to \(1\) and measures only the strength and direction of a linear relationship.
Correlation does not prove causation, and predictions far outside the data are unreliable.
How to use this algebra 1 correlation regression quiz
Retake this algebra 1 correlation regression quiz until every answer is right, then move on to the worksheet and the test.
Printable PDF · Quiz
Algebra 1 Two-Way Tables, Scatter Plots and Correlation quiz