



This algebra 1 correlation regression worksheet gives 24 problems on two-way tables, scatter plots and correlation, ordered from easy to hard, with a separate answer key.
These 24 problems cover joint, marginal and conditional relative frequencies in two-way tables, then move to scatter plots, lines of fit, residuals and the correlation coefficient. They align with Common Core S-ID.B.5, S-ID.B.6, S-ID.C.7, S-ID.C.8 and S-ID.C.9.
The problems get harder as you go. The last six are word problems that combine prediction, interpretation, residual plots, function choice and correlation versus causation.
Algebra 1 Correlation Regression Worksheet: problems 1–5
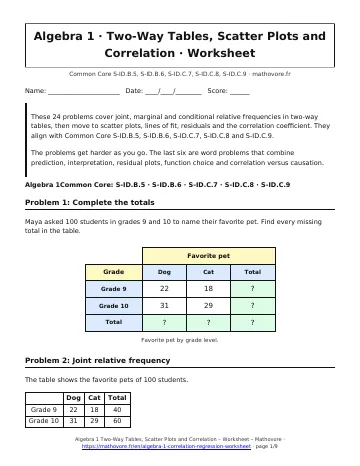
Problem 1: Complete the totals
Maya asked 100 students in grades 9 and 10 to name their favorite pet. Find every missing total in the table.
Problem 2: Joint relative frequency
The table shows the favorite pets of 100 students.
| Dog | Cat | Total | |
|---|---|---|---|
| Grade 9 | 22 | 18 | 40 |
| Grade 10 | 31 | 29 | 60 |
| Total | 53 | 47 | 100 |
- Find the joint relative frequency of grade 10 and cat as a decimal and a percent.
- Find the joint relative frequency of grade 9 and dog.
Problem 3: Marginal relative frequency
Use the table of 100 students.
| Dog | Cat | Total | |
|---|---|---|---|
| Grade 9 | 22 | 18 | 40 |
| Grade 10 | 31 | 29 | 60 |
| Total | 53 | 47 | 100 |
- Find the marginal relative frequency of students who prefer cats.
- Find the marginal relative frequency of grade 10 students.
Problem 4: Conditional frequency by row
Use the table of 100 students.
| Dog | Cat | Total | |
|---|---|---|---|
| Grade 9 | 22 | 18 | 40 |
| Grade 10 | 31 | 29 | 60 |
| Total | 53 | 47 | 100 |
Among grade 9 students only, find the relative frequency of dog fans and the relative frequency of cat fans.
Problem 5: Conditional frequency by column
Use the table of 100 students.
| Dog | Cat | Total | |
|---|---|---|---|
| Grade 9 | 22 | 18 | 40 |
| Grade 10 | 31 | 29 | 60 |
| Total | 53 | 47 | 100 |
Among students who prefer dogs, find the relative frequency of grade 9 students and of grade 10 students. Round to the nearest thousandth.
Algebra 1 Correlation Regression Worksheet: problems 6–10
Problem 6: Association in a two-way table
Priya asked 200 students whether they listen to music while studying and whether they scored above 80 on the last quiz.
| Above 80 | 80 or below | Total | |
|---|---|---|---|
| Music on | 44 | 36 | 80 |
| Music off | 66 | 54 | 120 |
| Total | 110 | 90 | 200 |
Compare the conditional relative frequencies of scoring above 80 for each group. Is there evidence of an association between music and quiz scores?
Problem 7: Fill in a two-way table
Of 80 students, 50 are in the band, 36 are in grade 9, and 28 are band members in grade 9. Complete the table, then find the conditional relative frequency of being in the band for a grade 9 student.
Problem 8: Classify scatter plots
Classify each scatter plot as a positive correlation, a negative correlation, or no correlation. Then name the plot with the weakest linear relationship.
Problem 9: Describe a scatter plot
Jamal plotted the price of nine used cars against their age.
Describe the direction, strength and form of the association, and identify the point that does not fit the pattern.
Problem 10: Write the line of fit
Aisha recorded her weekly practice time and the number of free throws she made out of 25. The drawn line passes through (1, 6) and (7, 18).
- Write an equation for the line.
- Predict the free throws made after 9 hours of practice.
Algebra 1 Correlation Regression Worksheet: problems 11–15
Problem 11: Predict from a line
At a lemonade stand, the line of best fit for cups sold \(y\) at an afternoon temperature of \(x\) degrees Fahrenheit is \(y=2.5x-100\).
- Predict the cups sold when the temperature is \(88^{\circ}\text{F}\).
- At what temperature is the stand predicted to sell 90 cups?
Problem 12: Interpret slope and intercept
A teacher models the final grade \(y\) (in points) of a student with \(x\) absences using \(y=-1.6x+91.4\). Interpret the slope and the y-intercept in context.
Problem 13: When the intercept has no meaning
The line \(y=0.36x-14.2\) models shoe size \(y\) from height \(x\) in inches for teenagers.
- Interpret the slope.
- Interpret the y-intercept. Does it make sense in context? Explain.
- Predict the shoe size of a teenager who is 70 inches tall.
Problem 14: Compute residuals
The line \(y=5x+52\) predicts a quiz score \(y\) from \(x\) hours of studying. Sofia studied 4 hours and scored 77. Noah studied 6 hours and scored 79. Find each residual and say whether the point lies above or below the line.
Problem 15: Residuals in a table
The line \(y=3x+5\) is fitted to five data points.
| x | 1 | 2 | 3 | 4 | 5 |
|---|---|---|---|---|---|
| y | 9 | 10 | 16 | 15 | 21 |
- Copy and complete a table with the predicted value and the residual for each point.
- Which points are farthest from the line?
- Find the sum of the residuals.
Algebra 1 Correlation Regression Worksheet: problems 16–20
Problem 16: Read residual plots
Diego fit a line to two different data sets and made a residual plot for each.
- For which data set is a linear model appropriate? Explain.
- What type of function might fit the other data set better?
Problem 17: Match r to the plot
Match each correlation coefficient to a scatter plot: \(r=0.73\), \(r=0.96\), \(r=-0.98\). Explain each choice.
Problem 18: Compare strength of r
Four data sets have correlation coefficients \(r=-0.88\), \(r=0.72\), \(r=-0.40\) and \(r=0.15\). Order them from the strongest to the weakest linear relationship. Does \(r=0.72\) show a stronger relationship than \(r=-0.88\)?
Problem 19: Choose the correct conclusion
A school finds \(r=0.78\) between the number of books in a student’s home and the student’s reading score. Which statement is supported by the data? Explain why each other statement is not.
- Buying more books will raise a child’s reading score.
- Students with more books at home tend to have higher reading scores.
- Low reading scores cause families to own fewer books.
- Books at home are the only factor that affects reading scores.
Problem 20: Find the lurking variable
Among elementary school students, shoe size and reading score have a strong positive correlation, \(r=0.85\). Does a larger shoe size cause a higher reading score? Identify a lurking variable.
Algebra 1 Correlation Regression Worksheet: problems 21–24
Problem 21: Hot chocolate sales
A cafe recorded cups of hot chocolate sold at six temperatures. The line of best fit is \(y=-1.3x+112\), where \(x\) is the temperature in degrees Fahrenheit.
| Temp (°F) | 20 | 30 | 40 | 50 | 60 | 70 |
|---|---|---|---|---|---|---|
| Cups | 86 | 71 | 62 | 48 | 36 | 22 |
- Predict the cups sold at \(25^{\circ}\text{F}\).
- Find the residual at \(40^{\circ}\text{F}\).
- Interpret the slope.
- Predict the cups sold at \(90^{\circ}\text{F}\) and comment on the result.
Problem 22: Lunch choices by grade
The cafeteria manager surveyed 250 students about school lunch.
- Find the joint relative frequency of grade 10 and packing lunch.
- Find the marginal relative frequency of buying lunch.
- Find the conditional relative frequency of buying lunch for each grade.
- Does the data suggest an association between grade and buying lunch? Explain.
Problem 23: Choose a function type
A lab counts the cells in a culture each hour.
| Hour | 0 | 1 | 2 | 3 | 4 | 5 |
|---|---|---|---|---|---|---|
| Cells | 2 | 4 | 8 | 16 | 32 | 64 |
- Explain why a line is not a good model.
- Choose linear, quadratic or exponential and write an equation.
- Predict the cells at hour 6.
Problem 24: Extrapolation risk
Using data for ages 10 to 15, a doctor found the line \(y=2.2x+30\) relating age \(x\) in years to height \(y\) in inches.
- Predict the height of a 13-year-old.
- Predict the height of a 40-year-old. Is the result believable? Explain.

How to use this algebra 1 correlation regression worksheet
Print this algebra 1 correlation regression worksheet as a PDF, solve every problem on paper, then compare with the answer key.

See every chapter on the Algebra 1 math page.