This algebra 1 correlation regression test checks two-way tables, scatter plots and correlation in 45 minutes, with 9 questions for a total of 20 points.
This 45-minute test has nine questions worth 20 points. It covers two-way tables, scatter plots, lines of fit, residuals, the correlation coefficient and the difference between correlation and causation. Show your work and write answers in complete sentences where a question asks you to explain or interpret.
- Grade: Algebra 1
- Chapter: Two-Way Tables, Scatter Plots and Correlation
- Common Core: S-ID.B.5, S-ID.B.6, S-ID.C.7, S-ID.C.8, S-ID.C.9
- Time: 45 minutes
- Total: 20 points (Question 1: 2 pts; Question 2: 3 pts; Question 3: 2 pts; Question 4: 3 pts; Question 5: 3 pts; Question 6: 2 pts; Question 7: 2 pts; Question 8: 2 pts; Question 9: 1 pt)
Algebra 1 Correlation Regression Test: questions 1–5
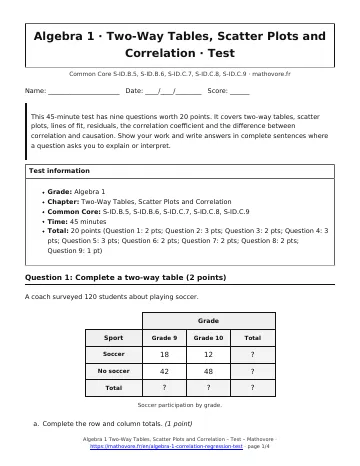
Question 1: Complete a two-way table (2 points)
A coach surveyed 120 students about playing soccer.
- Complete the row and column totals. (1 point)
- Find the marginal relative frequency of students who play soccer. (1 point)
Question 2: Compare conditional frequencies (3 points)
The principal recorded how 200 students arrived and whether they were late.
| Late | On time | Total | |
|---|---|---|---|
| Rides the bus | 9 | 81 | 90 |
| Does not ride the bus | 22 | 88 | 110 |
| Total | 31 | 169 | 200 |
- Find the joint relative frequency of riding the bus and being late. (1 point)
- Find the conditional relative frequency of being late for bus riders and for students who do not ride the bus. (1 point)
- Does the data suggest an association between riding the bus and being late? Justify the answer. (1 point)
Question 3: Describe a scatter plot (2 points)
The scatter plot shows the asking price of eight used laptops of different ages.
- Describe the direction, strength and form of the association. (1 point)
- Which value is most likely the correlation coefficient: \(0.98\), \(0.20\), \(-0.20\) or \(-0.98\)? (1 point)
Question 4: Line of fit and prediction (3 points)
A typing class recorded weekly practice time and typing speed for nine students. The line drawn on the scatter plot passes through (2, 30) and (8, 48).
- Write an equation of the line. (1 point)
- Interpret the slope in context. (1 point)
- Predict the typing speed after 10 hours of weekly practice. (1 point)
Question 5: Compute residuals (3 points)
The line \(y=2.5x+8\) is used to model four data points: (2, 15), (4, 17), (6, 26) and (8, 27).
- Find the predicted value for each point. (1 point)
- Find the residual for each point. (1 point)
- Which point lies farthest above the line? (1 point)
Algebra 1 Correlation Regression Test: questions 6–9
Question 6: Interpret a residual plot (2 points)
A student fit a line to a data set and graphed the residuals.
- Is a linear model appropriate for this data? Explain. (1 point)
- Describe how the residual plot would look if the line were a good fit. (1 point)
Question 7: Interpret the correlation coefficient (2 points)
A study of students found \(r=-0.84\) between weekly hours of video games and grade point average.
- Describe the direction and strength of the relationship. (1 point)
- A second study found \(r=0.31\) between hours of sleep and grade point average. Which study shows the stronger linear relationship? Explain. (1 point)
Question 8: Correlation and causation (2 points)
A fire department finds \(r=0.90\) between the number of fire trucks sent to a fire and the dollar damage the fire causes.
- Does this show that sending more fire trucks causes more damage? Explain. (1 point)
- Name a lurking variable that could explain the correlation. (1 point)
Question 9: Extrapolation (1 point)
Using readings from the first 6 hours, a line \(y=-14x+100\) models a phone’s battery percent \(y\) after \(x\) hours of use. Predict the battery percent after 10 hours and decide whether the prediction is reasonable.

How to use this algebra 1 correlation regression test
Take this algebra 1 correlation regression test without notes, then grade it with the test answer key out of 20 points.

See every chapter on the Algebra 1 math page.