

This algebra 1 correlation regression lesson explains two-way tables, scatter plots and correlation in one printable page, with definitions, a method and a worked example.
A scatter plot shows how two numerical variables relate, and a line of best fit turns that pattern into predictions. A two-way table organizes categorical data into joint, marginal and conditional relative frequencies. The correlation coefficient \(r\) measures linear strength from \(-1\) to \(1\), but a strong correlation never proves causation.
Algebra 1 Correlation Regression Lesson: key facts
- Joint, marginal and conditional relative frequencies come from a two-way table and are found by dividing by a grand total or by a row or column total.
- A residual equals the actual value minus the predicted value; a random residual plot means a line fits well.
- In \(y=mx+b\), the slope is the predicted change in \(y\) per 1-unit change in \(x\), and the y-intercept is the predicted \(y\) when \(x=0\).
- The correlation coefficient \(r\) ranges from \(-1\) to \(1\) and measures only the strength and direction of a linear relationship.
- Correlation does not prove causation, and predictions far outside the data are unreliable.
What do the relative frequencies in a two-way table mean?
A two-way table counts individuals in every combination of two categorical variables. Dividing a count by a total gives a relative frequency.
Joint: a cell count divided by the grand total.
Marginal: a row or column total divided by the grand total.
Conditional: a cell count divided by the total of its own row or column.
The joint relative frequency of a job and a GPA of 3.0 or higher is \(\frac{24}{150}=0.16\), or 16%. The marginal relative frequency of having a job is \(\frac{60}{150}=0.40\). The conditional relative frequency of a 3.0 or higher given a job is \(\frac{24}{60}=0.40\), but given no job it is \(\frac{63}{90}=0.70\). Because 40% and 70% differ so much, the data suggest an association between having a job and GPA.
How do you fit a line to a scatter plot?
- Plot the points. Describe the direction, the strength and the form (linear or curved).
- Choose a line that follows the points, or use technology to compute one.
- Write it as \(y=mx+b\) and use it to make predictions.
- Interpret the slope \(m\) as the predicted change in \(y\) for each 1-unit increase in \(x\), and the y-intercept \(b\) as the predicted \(y\) when \(x=0\).
Worked example. For the line \(y=4.0x+57.8\), each extra hour of studying adds about 4.0 points to the predicted score, and a student who studies 0 hours is predicted to score 57.8. At 3 hours the prediction is \(4.0(3)+57.8=69.8\).
What is a residual, and what does a residual plot show?
A residual is the actual value minus the predicted value. The student who studied 3 hours scored 74, so the residual is \(74-69.8=4.2\): the point lies 4.2 above the line. A residual plot graphs each residual against \(x\). Random scatter around zero means a line is a good fit. A curved pattern means another function, such as a quadratic or an exponential, may fit better.
What does the correlation coefficient r tell you?
The correlation coefficient \(r\) is a number from \(-1\) to \(1\) that measures how closely points follow a straight line. A positive \(r\) means a rising pattern and a negative \(r\) means a falling pattern. The closer \(r\) is to \(-1\) or \(1\), the stronger the linear relationship. For the study data, \(r\approx 0.96\). Remember that \(r\) only measures straight-line patterns.
Does correlation mean causation?
No. A strong \(r\) shows that two variables move together, not that one causes the other. A lurking variable may drive both: hot weather raises ice cream sales and also sunburns. Only a well-designed experiment with random assignment can support a causal claim. Also avoid extrapolation, which means predicting far outside the data.
Two-Way Tables, Scatter Plots and Correlation: frequently asked questions
What is the difference between joint, marginal and conditional relative frequency?
A joint relative frequency divides one cell by the grand total. A marginal relative frequency divides a row or column total by the grand total. A conditional relative frequency divides a cell by the total of its own row or column.
How do you interpret the slope of a line of best fit?
The slope is the predicted change in \(y\) for every 1-unit increase in \(x\). For the line \(y=4.0x+57.8\), each extra hour of studying is associated with about 4.0 more points on the quiz.
What is a residual?
A residual is the actual \(y\)-value minus the predicted \(y\)-value. A positive residual means the point is above the line, and a negative residual means it is below the line.
What does a correlation coefficient of \(-0.9\) mean?
It means a strong negative linear relationship: as \(x\) increases, \(y\) tends to decrease, and the points lie close to a falling line. It does not mean that \(x\) causes \(y\) to decrease.
Why can you not conclude causation from correlation?
A lurking variable can influence both variables, and the direction of cause can run either way. Only a randomized experiment can support a causal conclusion.
How to use this algebra 1 correlation regression lesson
Use this algebra 1 correlation regression lesson before the worksheet, then check what you learned with the quiz.

Printable PDF · Lesson
Algebra 1 Two-Way Tables, Scatter Plots and Correlation lesson
Download the PDF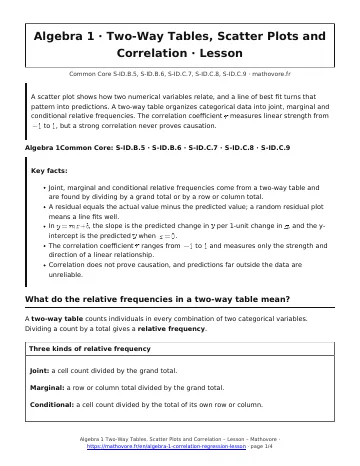
- Two-Way Tables, Scatter Plots and Correlation worksheet (24 problems)
- Two-Way Tables, Scatter Plots and Correlation quiz (10 questions)
- Two-Way Tables, Scatter Plots and Correlation test (45 minutes)
- Previous lesson: Statistics: Center, Spread and Data Displays
- Next lesson: Building Functions and Inverses
See every chapter on the Algebra 1 math page.