Key takeaway: This algebra 1 statistics one variable test contains eight questions, 20 points in all, and runs 45 minutes. Students find a mean, a five-number summary and a standard deviation, then read a box plot and a histogram. They also compare two distributions in context. A calculator is allowed.
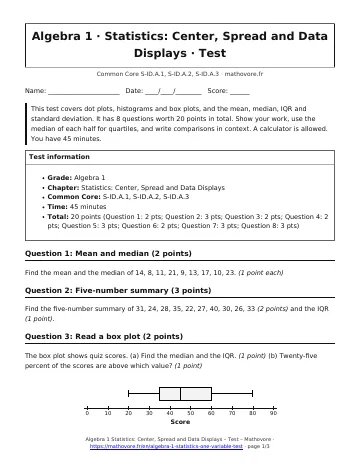
This test covers dot plots, histograms and box plots, and the mean, median, IQR and standard deviation. It has 8 questions worth 20 points in total. Show your work, use the median of each half for quartiles, and write comparisons in context. A calculator is allowed. You have 45 minutes.
- Grade: Algebra 1
- Chapter: Statistics: Center, Spread and Data Displays
- Common Core: S-ID.A.1, S-ID.A.2, S-ID.A.3
- Time: 45 minutes
- Total: 20 points (Question 1: 2 pts; Question 2: 3 pts; Question 3: 2 pts; Question 4: 2 pts; Question 5: 3 pts; Question 6: 2 pts; Question 7: 3 pts; Question 8: 3 pts)
Algebra 1 Statistics One Variable Test: questions 1–5
1. Mean and median (2 points)
Find the mean and the median of 14, 8, 11, 21, 9, 13, 17, 10, 23. (1 point each)
2. Five-number summary (3 points)
Find the five-number summary of 31, 24, 28, 35, 22, 27, 40, 30, 26, 33 (2 points) and the IQR (1 point).
3. Read a box plot (2 points)
The box plot shows quiz scores. (a) Find the median and the IQR. (1 point) (b) Twenty-five percent of the scores are above which value? (1 point)
4. Read a histogram (2 points)
The histogram shows the ages of 20 players. (a) How many players are 20 or older? (1 point) (b) In which interval is the median? (1 point)
5. Standard deviation (3 points)
Find the standard deviation of 3, 5, 6, 7, 9, treating the data as the whole group. Show the mean (1 point), the sum of the squared differences (1 point) and the standard deviation to the nearest tenth (1 point).
Algebra 1 Statistics One Variable Test: questions 6–8
6. Interpret standard deviation (2 points)
Two machines fill bags of rice. Machine A fills bags with a mean of 16.0 ounces and a standard deviation of 0.1 ounce. Machine B has a mean of 16.0 ounces and a standard deviation of 0.4 ounce. (a) Which machine is more consistent? (1 point) (b) Explain in the context of the bags. (1 point)
7. Effect of an outlier (3 points)
The data set is 15, 16, 18, 18, 20, 21. (a) Find the mean and median. (1 point) (b) The value 60 is added. Find the new mean and median. (1 point) (c) Which measure changed more, and why? (1 point)
8. Compare two distributions (3 points)
The box plots show the points two teams scored per game. (a) Compare the centers. (1 point) (b) Find and compare the IQRs. (1 point) (c) Which team’s scoring is more consistent? Explain. (1 point)

What is on the algebra 1 statistics one variable test?
Question 1 uses nine values, such as 14, 8, 11, 21, 9, 13, 17, 10 and 23. Question 2 asks for a five-number summary of ten temperatures, worth 3 points. Next, question 5 asks for the standard deviation of 3, 5, 6, 7, 9, where the mean is the first point.
How should you pace the statistics test?
Spend ten minutes on questions 1 and 2. Then give questions 7 and 8 a full ten minutes, because each is worth 3 points. Question 7 adds 60 to 15, 16, 18, 18, 20, 21 and asks which measure changes. Question 8 compares two box plots of team scores.
Which comparison sentences earn points?
- Name both medians and say which is larger.
- Quote both IQRs, then say which team is steadier.
- Mention the machine units in question 6.
How can you study for this test?
First, order a new list and find all five numbers. Then compute one standard deviation without a calculator. Finally, write one comparison sentence about two box plots and read it aloud to check clarity.

See every chapter on the Algebra 1 math page.