


Question 1: Mean and median (2 points)
Sum \(=126\); mean \(=126: 9=14\).
Ordered: 8, 9, 10, 11, 13, 14, 17, 21, 23. The 5th value is the median: 13.
Mean 14, median 13
Scoring: 1 point for the mean; 1 point for the median.
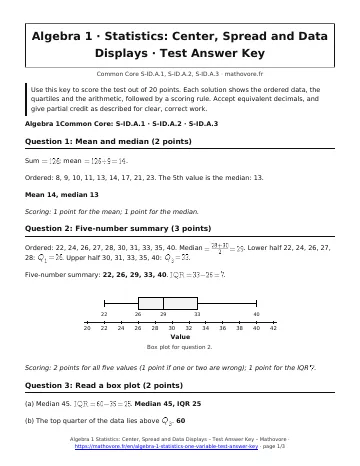
Question 2: Five-number summary (3 points)
Ordered: 22, 24, 26, 27, 28, 30, 31, 33, 35, 40. Median \(=\frac{28+30}{2}=29\). Lower half 22, 24, 26, 27, 28: \(Q_1=26\). Upper half 30, 31, 33, 35, 40: \(Q_3=33\).
Five-number summary: 22, 26, 29, 33, 40. \(\text{IQR}=33-26=7\).
Scoring: 2 points for all five values (1 point if one or two are wrong); 1 point for the IQR \(7\).
Question 3: Read a box plot (2 points)
(a) Median 45. \(\text{IQR}=60-35=25\). Median 45, IQR 25
(b) The top quarter of the data lies above \(Q_3\). 60
Scoring: 1 point for part (a) with both values correct; 1 point for part (b).
Question 4: Read a histogram (2 points)
(a) \(6+1=7\). 7 players
(b) The median is the mean of the 10th and 11th values. The first interval holds 4 values and the second brings the total to 13, so both are in 10 to 20.
Scoring: 1 point for each part.
Question 5: Standard deviation (3 points)
Mean \(=\frac{3+5+6+7+9}{5}=\frac{30}{5}=6\).
Differences: \(-3,-1,0,1,3\). Squares: 9, 1, 0, 1, 9, which add to 20.
Average \(=20: 5=4\). SD \(=\sqrt{4}=2\), that is 2.0.
Scoring: 1 point for the mean 6; 1 point for the sum 20; 1 point for the SD 2.0.
Question 6: Interpret standard deviation (2 points)
(a) Machine A.
(b) Machine A has the smaller standard deviation, so its bag weights stay closer to 16.0 ounces. Bags from Machine B vary more, so more of them are noticeably underweight or overweight.
Scoring: 1 point for Machine A; 1 point for an explanation that connects the smaller SD to weights staying closer to the mean.
Question 7: Effect of an outlier (3 points)
(a) Mean \(=108: 6=18\); median \(=\frac{18+18}{2}=18\).
(b) New sum \(=168\); mean \(=168: 7=24\). The 7 ordered values have median 18 (the 4th).
(c) The mean changed more (from 18 to 24, while the median stayed at 18). The extreme value 60 is pulled into the sum, but the median depends only on the middle position.
Scoring: 1 point for part (a); 1 point for part (b); 1 point for naming the mean with a reason.
Question 8: Compare two distributions (3 points)
(a) Both teams have the same median, 76 points.
(b) Team X: \(\text{IQR}=84-70=14\). Team Y: \(\text{IQR}=96-68=28\). Team Y’s IQR is twice as large.
(c) Team X is more consistent: its middle 50% of scores covers 14 points, while Team Y’s covers 28.
Scoring: 1 point for equal medians; 1 point for both IQRs and the comparison; 1 point for Team X with the reason.
20 points
See every chapter on the Algebra 1 math page.