Key takeaway: This algebra 1 statistics one variable worksheet gives you 24 problems on reading displays and measuring center and spread. You will read a dot plot, a box plot and a histogram, then compute a mean, a median, an IQR and a standard deviation. The last six problems use home prices, cookie weights, commute times and two test classes. An answer key is posted on its own page.
These 24 problems practice one-variable data analysis for S-ID.A.1, S-ID.A.2 and S-ID.A.3. Read dot plots, histograms and box plots, compute the mean, median, IQR and standard deviation, compare distributions, and decide how outliers change center and spread. The last six problems are real-world word problems.
Algebra 1 Statistics One Variable Worksheet: problems 1–5
1. Read a dot plot
The dot plot shows the number of pets in each of several households. (a) How many households were surveyed? (b) Find the mode. (c) How many households have at least 3 pets? (d) Find the range.
2. Find the mean
Find the mean of each data set. (a) Maya’s quiz scores: 8, 9, 7, 10, 6, 9, 8, 7. (b) Prices at a farmers market: $12, $15, $9, $20, $14.
3. Find the median
Find the median of each data set. (a) 14, 9, 21, 12, 17. (b) 30, 25, 28, 35, 22, 31.
4. Quartiles and IQR
Find the median, \(Q_1\), \(Q_3\) and the IQR of the minutes Liam spent reading each night: 6, 9, 12, 7, 15, 11, 8, 14, 10, 13.
5. Five-number summary
Find the five-number summary, the range and the IQR of these 11 temperatures in degrees Fahrenheit: 22, 35, 28, 31, 25, 40, 33, 29, 26, 38, 30.
Algebra 1 Statistics One Variable Worksheet: problems 6–10
6. Draw a box plot
A data set has minimum 12, \(Q_1=18\), median 23, \(Q_3=30\) and maximum 41. Draw a box plot on a number line from 10 to 45. Then find the range and the IQR.
7. Read a box plot
The box plot shows daily practice time for a group of students. Find the five-number summary, the range and the IQR. What percent of the students practiced more than 30 minutes?
8. Read a histogram
The histogram shows nightly homework time for a class. (a) How many students are represented? (b) How many students did 10 or more but fewer than 30 minutes? (c) In which interval is the median? (d) Can the exact mean be found from the histogram? Explain.
9. Build a histogram
These are the waiting times in minutes of 16 patients at a clinic: 3, 7, 12, 14, 15, 18, 21, 22, 23, 25, 26, 28, 31, 34, 37, 44. Make a frequency table with intervals 0 to 10, 10 to 20, 20 to 30, 30 to 40 and 40 to 50 (each includes its left edge), then draw the histogram.
10. Mean from a frequency table
The table shows goals scored by a soccer team in 20 games.
| Goals | 0 | 1 | 2 | 3 | 4 |
|---|---|---|---|---|---|
| Games | 4 | 6 | 5 | 3 | 2 |
Find the mean and the median number of goals.
Algebra 1 Statistics One Variable Worksheet: problems 11–15
11. Standard deviation by hand
Jamal made 2, 3, 3, 3, 5 and 8 points in six games. Find the mean and the standard deviation of his scores, treating them as the whole group.
12. Compare spread visually
Both dot plots have a mean of 5. Without calculating, which data set has the larger standard deviation? Then calculate both standard deviations to the nearest hundredth.
13. Interpret standard deviation
Two bus routes both have a mean delay of 6 minutes. Route 1 has a standard deviation of 1 minute. Route 2 has a standard deviation of 5 minutes. Which route is more predictable? Would a 15-minute delay be more surprising on Route 1 or on Route 2? Explain.
14. Compare box plots
The box plots show exam scores for two sections of a course. Compare the centers and the spreads. Which section performed better overall, and which was more consistent?
15. Test for outliers
Use the \(1.5\times \text{IQR}\) rule to decide whether the data set 12, 14, 15, 15, 16, 17, 18, 19, 21, 38 has any outliers.
Algebra 1 Statistics One Variable Worksheet: problems 16–20
16. Effect of an outlier
Find the mean and median of 4, 5, 6, 7, 8. Then add the value 31 and find the mean and median again. Which statistic changed more?
17. Choose the best measures
For each situation, choose the better pair of measures: (mean and SD) or (median and IQR). Explain. (a) Home prices in a town with a few very expensive mansions. (b) Heights of 30 classmates, roughly symmetric with no outliers. (c) Daily high temperatures for a month that includes one day of 110 degrees when all other days are between 70 and 82.
18. Describe the shape
Describe the shape of this distribution. Is the mean probably greater than, less than, or about equal to the median? Which measures of center and spread should be used?
19. Basketball points
Diego scored these points in 10 basketball games: 12, 15, 9, 22, 14, 11, 18, 15, 13, 21. (a) Find the mean. (b) Find the median and the IQR. (c) Find the standard deviation. (d) In an eleventh game Diego scores 40. Find the new mean and median, and tell which one changed more.
20. Commute times
Five-number summaries of commute times in minutes: City A: 10, 18, 25, 32, 50. City B: 15, 22, 25, 28, 35. Find each IQR, compare the two cities and decide which has the more predictable commute.
Algebra 1 Statistics One Variable Worksheet: problems 21–24
21. Missing quiz score
Aisha’s mean on five quizzes is 84. Her first four scores are 80, 92, 78 and 85. What did she score on the fifth quiz? What is the median of all five scores?
22. Home prices
Six homes on a street sold for (in thousands of dollars) 210, 225, 230, 240, 245 and 255. Find the mean and median. Then a mansion sells for 1,200. Find the new mean and median. Which measure better describes a typical home?
23. Cookie weights
Cookies from two bakeries weigh (in ounces) Bakery A: 1.8, 1.9, 2.0, 2.1, 2.2; Bakery B: 1.5, 1.8, 2.0, 2.2, 2.5. Show that both means are 2.0 ounces, find each standard deviation to the nearest hundredth, and say which bakery makes cookies of more consistent size.
24. Two classes
On the same test, Class 1 had a mean of 78 with a standard deviation of 4 points. Class 2 had a mean of 78 with a standard deviation of 12 points. Find the interval from one standard deviation below the mean to one standard deviation above it for each class. Which class would you expect to have more scores above 90? Which has more similar scores?

What skills does the algebra 1 statistics worksheet practice?
Problems 2 to 5 compute the mean, median and five-number summary, such as the 11 temperatures in problem 5. Problem 6 asks you to draw a box plot from a given summary, with minimum 12 and maximum 41. In contrast, problem 7 asks you to read one. Next, problem 9 builds a histogram from 16 waiting times .
Which statistics problems for algebra 1 are hardest?
Problem 11 requires standard deviation by hand for 2, 3, 3, 3, 5 and 8. The mean is 4, and the squared gaps add to 24, so the variance is 4. Problem 21 works backward. Aisha’s mean on five quizzes is 84, so the total is 420, and her last score is 85. Problem 15 applies the 1.5 IQR fence to a list that ends with 38.
How do the real-world problems help?
Problem 22 compares the mean and median of six home prices and explains which one the typical buyer should trust. Problem 24 compares two classes with the same mean of 78 but different spreads. As a result, you must write about consistency, not just averages.
- Order the data first.
- Then label the quartiles.
- Finally, write a sentence with units.
How can you check your work?
Compare each box plot you draw with the five numbers behind it. Then redo problem 16 with a different outlier to confirm which statistic moves most. Finally, read the answer key only after you finish.

Printable PDF · Worksheet
Algebra 1 Statistics: Center, Spread and Data Displays worksheet
Download the PDF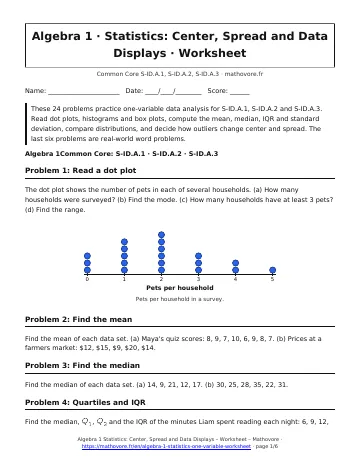
See every chapter on the Algebra 1 math page.