
This algebra 1 statistics worksheet answer key solves all 24 problems of the statistics: center, spread and data displays worksheet step by step.
Each solution shows the ordered data, the quartiles and the arithmetic. Quartiles use the median of each half, leaving out the overall median when the count is odd. Compare your displays with the figures and recompute any answer that differs.
Algebra 1 Statistics Worksheet Answer Key: problems 1–5
Problem 1: Read a dot plot
(a) Add the dots: \(3+5+6+3+2+1=20\). 20 households
(b) The tallest stack is at 2 pets. Mode: 2
(c) \(3+2+1=6\). 6 households
(d) \(5-0=5\). Range: 5
Problem 2: Find the mean
(a) Sum \(=8+9+7+10+6+9+8+7=64\). Mean \(=64: 8=8\). 8
(b) Sum \(=12+15+9+20+14=70\). Mean \(=70: 5=14\). \(\$14\)
Problem 3: Find the median
(a) Order: 9, 12, 14, 17, 21. The middle value is 14.
(b) Order: 22, 25, 28, 30, 31, 35. The two middle values are 28 and 30, so the median is \(\frac{28+30}{2}=29\). 29
Problem 4: Quartiles and IQR
Order: 6, 7, 8, 9, 10, 11, 12, 13, 14, 15. The median is \(\frac{10+11}{2}=10.5\).
Lower half 6, 7, 8, 9, 10: \(Q_1=8\). Upper half 11, 12, 13, 14, 15: \(Q_3=13\).
\(\text{IQR}=13-8=5\). Median 10.5, \(Q_1=8\), \(Q_3=13\), IQR 5
Problem 5: Five-number summary
Order: 22, 25, 26, 28, 29, 30, 31, 33, 35, 38, 40. The median is the 6th value, 30. With an odd count, leave it out.
Lower half 22, 25, 26, 28, 29: \(Q_1=26\). Upper half 31, 33, 35, 38, 40: \(Q_3=35\).
Five-number summary: 22, 26, 30, 35, 40. Range \(=40-22=18\). IQR \(=35-26=9\).
Algebra 1 Statistics Worksheet Answer Key: problems 6–10
Problem 6: Draw a box plot
Mark 12, 18, 23, 30 and 41 on the number line. Draw a box from 18 to 30 with a line at 23, then whiskers to 12 and to 41.
Range \(=41-12=29\). IQR \(=30-18=12\). Range 29, IQR 12
Problem 7: Read a box plot
Reading the plot: minimum 5, \(Q_1=15\), median 20, \(Q_3=30\), maximum 45.
Range \(=45-5=40\). IQR \(=30-15=15\).
One quarter of the data lies above \(Q_3\), so 25% practiced more than 30 minutes.
Problem 8: Read a histogram
(a) \(3+7+9+5+1=25\). 25 students
(b) \(7+9=16\). 16 students
(c) The median is the 13th value. The first two bars hold \(3+7=10\) values and the third bar brings the total to 19, so the 13th value is in 20 to 30.
(d) No. The histogram shows how many values fall in each interval, not the exact values, so only an estimate is possible.
Problem 9: Build a histogram
Count the values in each interval:
| Interval | 0-10 | 10-20 | 20-30 | 30-40 | 40-50 |
|---|---|---|---|---|---|
| Frequency | 2 | 4 | 6 | 3 | 1 |
The total is \(2+4+6+3+1=16\), which matches the data. Draw touching bars with these heights.
Problem 10: Mean from a frequency table
Total goals \(=0(4)+1(6)+2(5)+3(3)+4(2)=0+6+10+9+8=33\). Mean \(=33: 20=1.65\).
For the median, use the 10th and 11th values. The first 4 games had 0 goals and the next 6 games had 1 goal, so the 10th value is 1 and the 11th value is 2. Median \(=\frac{1+2}{2}=1.5\). Mean 1.65, median 1.5
Algebra 1 Statistics Worksheet Answer Key: problems 11–15
Problem 11: Standard deviation by hand
Mean \(=\frac{2+3+3+3+5+8}{6}=\frac{24}{6}=4\).
| Score | 2 | 3 | 3 | 3 | 5 | 8 |
|---|---|---|---|---|---|---|
| Minus 4 | \(-2\) | \(-1\) | \(-1\) | \(-1\) | 1 | 4 |
| Squared | 4 | 1 | 1 | 1 | 1 | 16 |
Sum of squares \(=4+1+1+1+1+16=24\). Average \(=24: 6=4\). SD \(=\sqrt{4}=2\). Mean 4, SD 2 points
Problem 12: Compare spread visually
Data set B is more spread out, so B has the larger SD.
A: squared differences \(1,1,0,0,0,0,1,1\) add to 4; \(4: 8=0.5\); SD \(=\sqrt{0.5}\approx 0.71\).
B: squared differences \(16,4,1,0,0,1,4,16\) add to 42; \(42: 8=5.25\); SD \(=\sqrt{5.25}\approx 2.29\).
\(0.71\) and \(2.29\)
Problem 13: Interpret standard deviation
Route 1 has the smaller SD, so its delays stay close to 6 minutes: Route 1 is more predictable.
A 15-minute delay is 9 minutes above the mean. That is 9 standard deviations on Route 1 but only 1.8 standard deviations on Route 2 (\(9: 5=1.8\)). So it would be more surprising on Route 1.
Problem 14: Compare box plots
Medians: Section A 75, Section B 70, so Section A is higher by 5 points.
IQR: Section A \(84-68=16\), Section B \(80-60=20\). Range: A \(96-55=41\), B \(100-40=60\).
Section A scored higher at the center and was more consistent, with a smaller IQR and range.
Problem 15: Test for outliers
The median is \(\frac{16+17}{2}=16.5\). Lower half 12, 14, 15, 15, 16: \(Q_1=15\). Upper half 17, 18, 19, 21, 38: \(Q_3=19\). \(\text{IQR}=19-15=4\).
\(1.5\times 4=6\). Lower fence \(15-6=9\); upper fence \(19+6=25\).
The value 38 is above 25, so 38 is an outlier. No value is below 9.
Algebra 1 Statistics Worksheet Answer Key: problems 16–20
Problem 16: Effect of an outlier
Before: mean \(=\frac{30}{5}=6\), median 6.
After: sum \(=30+31=61\). Mean \(=61: 6\approx 10.2\). The ordered data 4, 5, 6, 7, 8, 31 have median \(\frac{6+7}{2}=6.5\).
The mean rose by about 4.2 and the median rose by only 0.5. The mean changed more.
Problem 17: Choose the best measures
(a) Median and IQR: the mansions skew the data right and would drag the mean upward.
(b) Mean and SD: the data are symmetric and have no outliers, so these measures describe them well.
(c) Median and IQR: the 110-degree day is an outlier that would distort the mean and the SD.
Problem 18: Describe the shape
Most students play few hours and a few play many, so the distribution is skewed right.
The long tail of large values pulls the mean up, so the mean is probably greater than the median. (The median is the 12th value, which lies in the 2 to 4 interval.)
For skewed data, use the median and IQR.
Problem 19: Basketball points
(a) Sum \(=150\), so the mean is \(150: 10=15\).
(b) Order: 9, 11, 12, 13, 14, 15, 15, 18, 21, 22. Median \(=\frac{14+15}{2}=14.5\). \(Q_1=12\), \(Q_3=18\), \(\text{IQR}=18-12=6\).
(c) Differences from 15: \(-3,0,-6,7,-1,-4,3,0,-2,6\). Squares: 9, 0, 36, 49, 1, 16, 9, 0, 4, 36, which add to 160. \(160: 10=16\), SD \(=\sqrt{16}=4\).
(d) New sum \(=190\); new mean \(=190: 11\approx 17.27\). The 11 ordered values have median 15 (the 6th). The mean rose by about 2.27 and the median by 0.5, so the mean changed more.
Problem 20: Commute times
City A: \(\text{IQR}=32-18=14\). City B: \(\text{IQR}=28-22=6\). The medians are both 25 minutes.
The typical commute is the same, but City B’s middle half is much tighter and its range is smaller (20 minutes against 40). City B has the more predictable commute.
Algebra 1 Statistics Worksheet Answer Key: problems 21–24
Problem 21: Missing quiz score
Total for five quizzes \(=5\times 84=420\). The first four add to \(80+92+78+85=335\).
Fifth score \(=420-335=85\). 85
Ordered: 78, 80, 85, 85, 92. Median 85
Problem 22: Home prices
Before: sum \(=1,405\). Mean \(=1,405: 6\approx 234.2\), median \(=\frac{230+240}{2}=235\).
After: sum \(=1,405+1,200=2,605\). Mean \(=2,605: 7\approx 372.1\). The 7 ordered prices have median 240 (the 4th).
The mean jumped by about 138 thousand dollars while the median moved by 5 thousand. The median better describes a typical home.
Problem 23: Cookie weights
A: sum \(=10.0\), mean \(=2.0\). B: sum \(=10.0\), mean \(=2.0\).
A: differences \(-0.2,-0.1,0,0.1,0.2\); squares add to \(0.04+0.01+0+0.01+0.04=0.10\); \(0.10: 5=0.02\); SD \(=\sqrt{0.02}\approx 0.14\).
B: differences \(-0.5,-0.2,0,0.2,0.5\); squares add to \(0.25+0.04+0+0.04+0.25=0.58\); \(0.58: 5=0.116\); SD \(=\sqrt{0.116}\approx 0.34\).
The means are equal, but A has the smaller SD, so Bakery A makes more consistent cookies (SD \(0.14\) against \(0.34\) ounces).
Problem 24: Two classes
Class 1: \(78-4=74\) to \(78+4=82\). Class 2: \(78-12=66\) to \(78+12=90\).
Class 2’s scores spread much wider, so its high scores can reach beyond 90: Class 2 is more likely to have scores above 90.
Class 1’s smaller SD means its scores are clustered close to 78: Class 1 has more similar scores.
How to use this algebra 1 statistics worksheet answer key
Read this algebra 1 statistics worksheet answer key after trying each problem yourself, and redo any problem you missed.

Printable PDF · Worksheet Answer Key
Algebra 1 Statistics: Center, Spread and Data Displays worksheet answer key
Download the PDF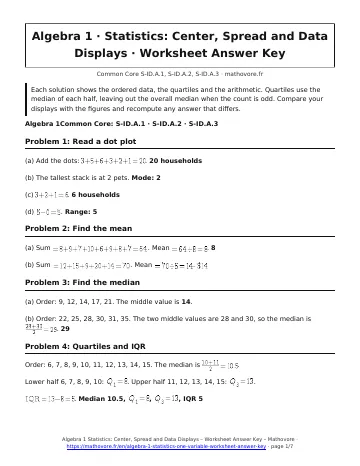
See every chapter on the Algebra 1 math page.