
This grade 8 two way tables lesson explains two-way tables in one printable page, with definitions, a method and a worked example.
A two-way table organizes data on two categorical variables by counting how many individuals fall in each pair of categories. Divide counts by a row or column total to get relative frequencies. If the relative frequencies differ noticeably between groups, the variables may be associated.
Grade 8 Two Way Tables Lesson: key facts
- Standard 8.SP.A.4: build and interpret two-way tables, and use relative frequencies to describe possible association.
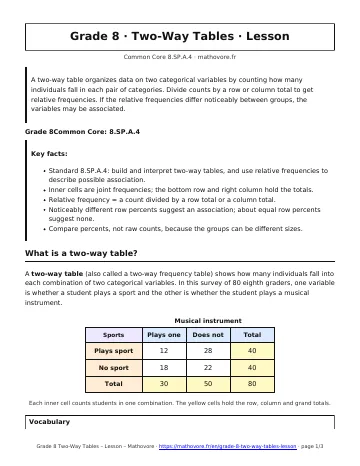
- Inner cells are joint frequencies; the bottom row and right column hold the totals.
- Relative frequency = a count divided by a row total or a column total.
- Noticeably different row percents suggest an association; about equal row percents suggest none.
- Compare percents, not raw counts, because the groups can be different sizes.
What is a two-way table?
A two-way table (also called a two-way frequency table) shows how many individuals fall into each combination of two categorical variables. In this survey of 80 eighth graders, one variable is whether a student plays a sport and the other is whether the student plays a musical instrument.
Frequency: a count, such as 12 students who play a sport and an instrument.
Total (marginal) frequency: a row or column sum, such as 40 students who play a sport.
Relative frequency: a count divided by a total, often written as a percent.
How do you find relative frequencies?
- Decide which group you are describing, such as students who play a sport.
- Divide each count in that row by the row total.
- Write each quotient as a percent.
Worked example. Among the 40 students who play a sport, \(\frac{12}{40}=30\%\) play an instrument and \(\frac{28}{40}=70\%\) do not. Among the 40 students with no sport, \(\frac{18}{40}=45\%\) play an instrument.
How do you tell whether two variables are associated?
Compare the row relative frequencies. If they are noticeably different, the data suggest an association: here, students with no sport are more likely to play an instrument (45% versus 30%). If the percents are about equal, there is no clear association.
In the lunch survey below, \(\frac{20}{50}=40\%\) of seventh graders and \(\frac{24}{60}=40\%\) of eighth graders chose pizza, so grade and lunch pick show no association even though the counts differ.
An association describes a pattern in the data. It does not prove that one variable causes the other.
Two-Way Tables: frequently asked questions
What is a two-way table?
It is a table that counts data in two categorical variables at once. One variable labels the rows, the other labels the columns, and each cell counts the individuals in one pair of categories.
What is a relative frequency?
It is a count divided by a total, usually written as a percent. In the sports survey, \(\frac{12}{40}=30\%\) of the sports players also play an instrument.
Should you divide by the row total or the column total?
Divide by the total of the group named in the question. For “students who play a sport,” use the sport row total. For “students who play an instrument,” use the instrument column total.
How can you tell if there is an association?
Compare the relative frequencies of the groups. If they differ noticeably, such as 30% and 45%, there may be an association. If they are nearly equal, there is no clear association.
Why compare percents instead of counts?
Groups often have different sizes. If 45 of 120 students in one grade and 27 of 60 in another own a tablet, the first count is larger, but the percents are 37.5% and 45%.
How to use this grade 8 two way tables lesson
Use this grade 8 two way tables lesson before the worksheet, then check what you learned with the quiz.

See every chapter on the Grade 8 math page.