Key takeaway: This grade 8 scatter plots worksheet provides 23 printable problems on plotting data and describing patterns. It aligns with standard 8.SP.A.1 for 8th grade, and complete solutions appear on a separate page.
Describe every pattern in a full sentence that names both variables, because the words carry the meaning.
These 23 problems practice standard 8.SP.A.1: reading and constructing scatter plots, describing positive, negative and no association, telling linear from nonlinear patterns, and spotting clusters and outliers.
The problems start with reading points and move to plotting tables and explaining patterns in context. The last six are word problems with several parts.
Grade 8 Scatter Plots Worksheet: problems 1–5
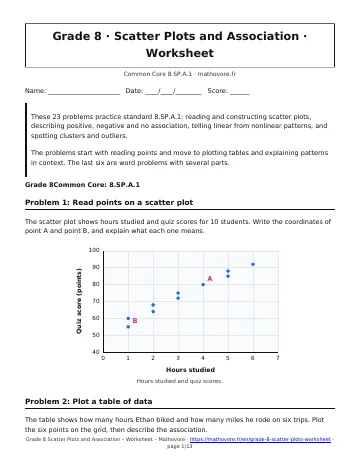
1. Read points on a scatter plot
The scatter plot shows hours studied and quiz scores for 10 students. Write the coordinates of point A and point B, and explain what each one means.
2. Plot a table of data
The table shows how many hours Ethan biked and how many miles he rode on six trips. Plot the six points on the grid, then describe the association.
| Hours | Miles |
|---|---|
| 1 | 6 |
| 2 | 13 |
| 3 | 17 |
| 4 | 25 |
| 5 | 29 |
| 6 | 36 |
3. Describe a positive association
Describe the association between hours studied and quiz score in the scatter plot. Tell what it means in this situation.
4. Describe a negative association
The scatter plot compares the outside temperature with the cups of cocoa a coffee shop sold. Describe the association.
5. Describe no association
The scatter plot compares shoe size with test score for 10 students. Does it show an association? Explain.
Grade 8 Scatter Plots Worksheet: problems 6–10
6. Name the association from a description
Name the association (positive, negative, or none) described in each statement.
- As the number of miles driven increases, the amount of gas left in the tank tends to decrease.
- Taller students tend to have longer arm spans.
- Knowing a student’s birth month tells nothing about her height.
7. Recognize a nonlinear association
Sofia kicked a soccer ball. The scatter plot shows the height of the ball each second. Is the association linear or nonlinear? Why is it not positive or negative?
8. Describe a curved negative pattern
The scatter plot shows the value of a car as it ages. Describe the association.
9. Find the outlier
A coach plotted weekly practice hours and free throws made out of 20. Identify the outlier and explain how you know.
10. Find the clusters
The scatter plot shows the ages and heights of 12 campers. Describe any clusters and the overall association.
Grade 8 Scatter Plots Worksheet: problems 11–15
11. Predict the association
For each pair of variables, tell whether a scatter plot would most likely show a positive association, a negative association, or no association.
- The age of a puppy (in weeks) and its weight
- The number of absences and the final grade in a class
- A student’s shoe size and the number of pets she has
12. Find the outlier in a table
Noah recorded the weeks since planting and the height of a bean plant (in inches). One measurement is probably a mistake. Find it and explain.
| Weeks | Height (in.) |
|---|---|
| 1 | 3 |
| 2 | 5 |
| 3 | 6 |
| 4 | 8 |
| 5 | 19 |
| 6 | 11 |
| 7 | 12 |
| 8 | 14 |
13. Plot and describe a table
The table shows the number of days absent and the final grade for eight students. Plot the points and describe the association.
| Days absent | Final grade |
|---|---|
| 0 | 96 |
| 1 | 93 |
| 2 | 90 |
| 3 | 85 |
| 4 | 83 |
| 5 | 78 |
| 6 | 74 |
| 7 | 70 |
14. True or false about a plot
Use the scatter plot of hours studied and quiz scores. Tell whether each statement is true or false.
- Every student who studied more than 4 hours scored above 80.
- Two students studied 3 hours and earned the same score.
- The plot shows a positive association.
- The student who studied 6 hours had the lowest score.
15. Find the mistake
Jamal looked at the cocoa plot and said, “Temperature goes up and cups sold goes down, so this is a positive association.” Explain his mistake.
Grade 8 Scatter Plots Worksheet: problems 16–20
16. Count points that meet a condition
Use the plot of hours studied and quiz scores. (a) How many students scored at least 80 points? (b) How many students studied 2 hours or less?
17. Plot and describe a curved pattern
An orchard owner recorded the age of an apple tree and the bushels of apples it produced. Plot the points and describe the association.
| Age (years) | Bushels |
|---|---|
| 1 | 1 |
| 2 | 3 |
| 3 | 6 |
| 4 | 10 |
| 5 | 14 |
| 6 | 17 |
| 7 | 19 |
| 8 | 20 |
18. Clusters and association together
The scatter plot shows the weight and gas mileage of eight vehicles. Describe the clusters and the overall association, and suggest why the clusters exist.
19. Association is not causation
A town found a positive association between monthly ice cream sales and monthly sunburn cases. Does buying ice cream cause sunburn? Explain.
20. Read the plot in context
The cocoa plot shows daily sales at different temperatures. (a) About how many cups were sold on the 50°F day? (b) About how many on the 70°F day? (c) How many more cups were sold on the cooler day?
Grade 8 Scatter Plots Worksheet: problems 21–23
21. Write your own scenario
Describe a situation with a negative association between two variables, and list four data pairs that fit your situation.
22. Effect of an outlier
The coach learns that the player in the plot with 7 hours and 3 made shots was injured that week. (a) Which point is that? (b) Describe the association for the other eight players.
23. Describe every feature
The plot shows nine vehicles. Describe the clusters, the outlier, and the overall association. Include the coordinates of the outlier.

What is on this 8th grade scatter plots worksheet?
Problems 1 to 3 read coordinates and describe a study-time plot. Then problems 4 and 5 compare a negative cocoa pattern with a shoe-size plot that shows nothing. Problems 7 and 8 turn to curves, using a kicked soccer ball and an aging car.
Which scatter plot problems need extra care?
The outlier in problem 9 comes from a coach’s practice-hours plot, so name the point and say why it breaks the pattern. In problem 12, a table hides a bean plant measurement that is probably a recording error. Problem 15 asks you to fix Jamal, who called a falling pattern positive because both words sounded upbeat.
Problem 22 asks what happens to the pattern when an injured player is removed.
How do the real-world problems connect to cause?
Problem 19 pairs ice cream sales with sunburn cases. A strong pattern exists, yet buying ice cream does not burn skin. Therefore the answer should mention a hidden cause, such as sunny days.
What comes after finishing these 23 plots?
Match every description to the solutions and underline the words for direction and shape. Then redraw problem 13 from its table, and let the quiz show whether the vocabulary sticks.

See every chapter on the Grade 8 math page.