


Each solution gives the answer in bold and the reason for it. For plotting problems, the answer shows the finished graph. If your description differs, check the direction of the points first, then whether they follow a line or a curve.
Problem 1: Read points on a scatter plot
Point A is above 4 on the horizontal axis and level with 80 on the vertical axis: A = (4, 80). This student studied 4 hours and scored 80 points.
Point B is at B = (1, 55). This student studied 1 hour and scored 55 points.
Problem 2: Plot a table of data
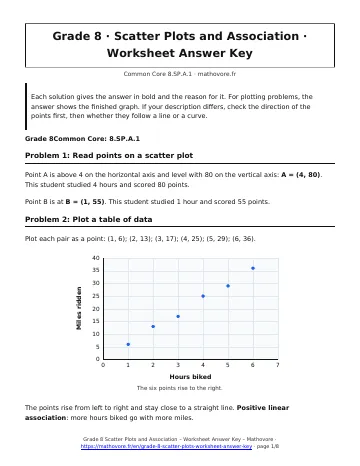
Plot each pair as a point: (1, 6); (2, 13); (3, 17); (4, 25); (5, 29); (6, 36).
The points rise from left to right and stay close to a straight line. Positive linear association: more hours biked go with more miles.
Problem 3: Describe a positive association
The points rise from left to right and lie close to a straight line.
Positive linear association. Students who studied more hours tended to earn higher quiz scores.
Problem 4: Describe a negative association
The points fall from left to right in a nearly straight pattern.
Negative linear association. On warmer days the shop sold fewer cups of cocoa.
Problem 5: Describe no association
The points do not rise or fall, and they do not follow a line or a curve. They are spread out with no pattern.
No association. Shoe size does not predict test score.
Problem 6: Name the association from a description
- Miles up, gas down: negative association.
- Both measurements increase together: positive association.
- No relationship between the variables: no association.
Problem 7: Recognize a nonlinear association
The points form a curve that rises to 16 feet at 4 seconds and then falls back to 0.
Nonlinear association. It is not simply positive or negative because the height increases at first and then decreases.
Problem 8: Describe a curved negative pattern
The points go down from left to right, but they follow a curve instead of a line: the value drops fast in the first years and then levels off.
Negative nonlinear association.
Problem 9: Find the outlier
The eight other points rise steadily. At 7 hours the pattern predicts about 16 free throws, but one point shows only 3.
The outlier is (7, 3). It is far from the pattern of the other points.
Problem 10: Find the clusters
There are two clusters with a gap between them.
Cluster 1: ages 8 to 10, heights 50 to 56 inches. Cluster 2: ages 14 to 16, heights 64 to 70 inches.
Overall the points rise, so there is a positive association: older campers are taller.
Problem 11: Predict the association
- Puppies gain weight as they grow: positive.
- More absences usually mean a lower grade: negative.
- The two have no connection: no association.
Problem 12: Find the outlier in a table
From week 1 to week 4 the height grows about 1.7 inches per week: 3, 5, 6, 8. Weeks 6, 7 and 8 continue the pattern with 11, 12 and 14.
At week 5 the pattern gives about 9 or 10 inches, but the table shows 19. The outlier is (5, 19). It does not fit the pattern.
Problem 13: Plot and describe a table
Plot the points (0, 96); (1, 93); (2, 90); (3, 85); (4, 83); (5, 78); (6, 74); (7, 70).
The points fall from left to right along a line: negative linear association. Students with more absences tended to have lower grades.
Problem 14: True or false about a plot
- True. The points with more than 4 hours are (5, 85), (5, 88) and (6, 92).
- False. The two points at 3 hours are (3, 72) and (3, 75).
- True. The points rise from left to right.
- False. The student with 6 hours scored 92, the highest score.
Problem 15: Find the mistake
Jamal read the plot correctly, but he named it incorrectly. When one variable increases and the other decreases, the points fall from left to right.
This is a negative association. A positive association needs both variables to increase together.
Problem 16: Count points that meet a condition
(a) Points at or above the 80 line: (4, 80), (5, 85), (5, 88), (6, 92). 4 students.
(b) Points with 2 hours or less: (1, 55), (1, 60), (2, 64), (2, 68). 4 students.
Problem 17: Plot and describe a curved pattern
Plot the points (1, 1); (2, 3); (3, 6); (4, 10); (5, 14); (6, 17); (7, 19); (8, 20).
The points rise, so the association is positive. The increases get larger at first (2, 3, 4) and then smaller (3, 2, 1), so the points follow a curve: positive nonlinear association.
Problem 18: Clusters and association together
Clusters: four light vehicles (2.6 to 3.1 thousand pounds) with 30 to 36 mpg, and four heavy vehicles (5.2 to 6.4 thousand pounds) with 15 to 19 mpg.
The points fall from left to right: negative association. The clusters probably match two vehicle types, such as compact cars and large trucks.
Problem 19: Association is not causation
No. A positive association shows that the two values rise together, not that one causes the other.
Hot, sunny weather is a third factor: it makes people buy ice cream and spend time in the sun.
Problem 20: Read the plot in context
(a) Point A is (50, 31): 31 cups.
(b) Point B is (70, 12): 12 cups.
(c) \(31-12=19\), so 19 more cups were sold at 50°F.
Problem 21: Write your own scenario
Sample answer. The more time Liam spends on screens at night, the fewer hours he sleeps. Four pairs (hours of screen time, hours of sleep): (1, 9), (2, 8.5), (4, 7), (6, 5.5).
As the first number increases, the second decreases, so the points would fall from left to right.
Problem 22: Effect of an outlier
(a) The injured player is the outlier (7, 3).
(b) The other eight points rise steadily along a line: positive linear association. More practice goes with more free throws made.
Problem 23: Describe every feature
Clusters: light vehicles at the left (30 to 36 mpg) and heavy vehicles at the right (15 to 19 mpg).
Outlier: (4.4, 38), a medium-weight vehicle with very high mileage, far from where the pattern would put it.
Overall: the points fall from left to right, a negative association: heavier vehicles tend to get fewer miles per gallon.
See every chapter on the Grade 8 math page.