


This key gives a worked solution and a scoring guide for each of the 8 questions, for a total of 20 points. Accept equivalent wording, such as going down instead of negative, as long as the direction and the shape are both clearly stated. Give partial credit as described.
Question 1: Read points on a scatter plot (2 points)
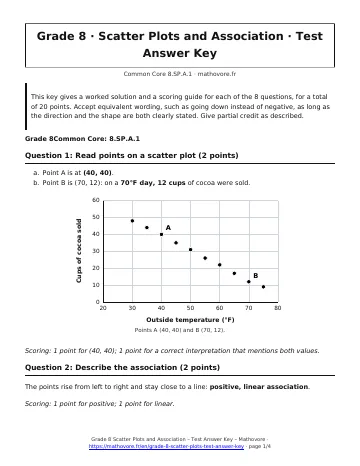
- Point A is at (40, 40).
- Point B is (70, 12): on a 70°F day, 12 cups of cocoa were sold.
Scoring: 1 point for (40, 40); 1 point for a correct interpretation that mentions both values.
Question 2: Describe the association (2 points)
The points rise from left to right and stay close to a line: positive, linear association.
Scoring: 1 point for positive; 1 point for linear.
Question 3: Linear or nonlinear (2 points)
Nonlinear. The points go down along a curve: the value falls by 4 in the first year and by only 0.6 in the last year, so they do not lie near a straight line.
Scoring: 1 point for nonlinear; 1 point for a valid reason.
Question 4: Clusters and outliers (3 points)
- The outlier is (4.4, 38).
- There are two clusters: four light vehicles (weights 2.6 to 3.1 thousand pounds, 30 to 36 mpg) and four heavy vehicles (5.2 to 6.4 thousand pounds, 15 to 19 mpg).
- Negative association: heavier vehicles tend to have lower mileage.
Scoring: 1 point for each part.
Question 5: Construct a scatter plot (4 points)
- The graph shows the eight points.
- The points fall from left to right: negative linear association.
- Students with more screen time tended to sleep fewer hours.
Scoring: (a) 2 points for all eight points correct, 1 point for six or seven correct; (b) 1 point for negative and linear; (c) 1 point for a correct interpretation.
Question 6: Classify the association (3 points)
- Positive. Taller people tend to have longer arms.
- Negative. Colder days mean higher heating bills.
- No association. The two are unrelated.
Scoring: 1 point for each correct classification.
Question 7: Association and cause (2 points)
No. The size of the fire is a third factor: bigger fires get more firefighters and also cause more damage. An association alone does not show cause.
Scoring: 1 point for answering no; 1 point for a reasonable explanation.
Question 8: Evaluate a claim about an outlier (2 points)
She is not correct. An outlier is a point far from the pattern, not a point outside the axes. The point (7, 3) is far below the other points, which rise to 16 and 17 shots.
Scoring: 1 point for saying she is incorrect and naming (7, 3); 1 point for the reason that it is far from the pattern.
20 points
See every chapter on the Grade 8 math page.