
Key takeaway: This algebra 2 normal distribution test has nine questions and 20 points in total. It covers mean and standard deviation, light bulb and apple weights, z-score comparisons, study design and a margin of error from simulation. Use a calculator and a z-table where needed, and show your work for full credit.
This test has 9 questions worth 20 points in total. It covers means and standard deviations, normal distributions and z-scores, study design, and margin of error from simulation. Use a calculator and a z-table where needed, and show your work for full credit.
- Grade: Algebra 2
- Chapter: Data, Normal Distributions and Statistical Inference
- Common Core: S-ID.A.4, S-IC.A.1, S-IC.B.3, S-IC.B.4
- Time: 45 minutes
- Total: 20 points (Question 1: 2 pts; Question 2: 2 pts; Question 3: 2 pts; Question 4: 2 pts; Question 5: 2 pts; Question 6: 2 pts; Question 7: 2 pts; Question 8: 3 pts; Question 9: 3 pts)
Algebra 2 Normal Distribution Test: questions 1–5
1. Mean and standard deviation (2 points)
Maya practiced the violin for 4, 6, 6, 8 and 11 hours in five weeks.
- Find the mean. (1 point)
- Find the standard deviation \(\sigma\) to the nearest tenth. (1 point)
2. Light bulb lifetimes (2 points)
The lifetimes of a brand of light bulb are approximately normal with mean 1,200 hours and standard deviation 80 hours.
- Find the interval that contains the middle \(95\%\) of lifetimes . (1 point)
- Find the percent of bulbs that last longer than 1,360 hours. (1 point)
3. Compare z-scores (2 points)
Priya scored 88 in algebra (class mean 80, standard deviation 4) and 90 in history (class mean 82, standard deviation 8).
- Find the z-score for each subject. (1 point)
- In which subject did she do better compared with the class? Explain. (1 point)
4. Apple weights (2 points)
The weights of apples at a farm stand are approximately normal with mean 7.0 oz and standard deviation 0.5 oz. Use a z-table or calculator.
- Find the z-score of a 7.6 oz apple. (1 point)
- What proportion of apples weigh less than 7.6 oz? (1 point)
5. Puzzle times (2 points)
The time to finish a puzzle is approximately normal with mean 20 minutes and standard deviation 4 minutes. The shaded region lies between 16.4 and 25.2 minutes.
- Find the z-scores of 16.4 and 25.2. (1 point)
- Find the proportion of puzzle times in the shaded region. (1 point)
Algebra 2 Normal Distribution Test: questions 6–9
6. Identify the study (2 points)
A hospital randomly assigns 80 patients with high blood pressure to take either a new pill or a placebo. Blood pressure is measured again after 12 weeks.
- Is this an experiment or an observational study? (1 point)
- Explain why the random assignment lets researchers draw a conclusion about cause and effect. (1 point)
7. Sampling plan (2 points)
A principal wants the opinion of the 1,200 students about a later start time. She asks the first 60 students who arrive by car.
- Explain why this sample may be biased. (1 point)
- Describe a method that selects a random sample of 60 students. (1 point)
8. Margin of error (3 points)
Maya simulates 200 random samples of 100 voters from a population in which \(55\%\) support a measure. The histogram shows the percent in favor in each sample.
- Ignoring the 5 lowest and the 5 highest results, give the interval that holds the middle \(95\%\). (1 point)
- Estimate the margin of error. (1 point)
- A real poll of 100 voters finds \(62\%\) in favor. Give an interval of plausible values and tell whether \(50\%\) is plausible. (1 point)
9. Delivery times (3 points)
Delivery times for a pizza shop are approximately normal with mean 28 minutes and standard deviation 5 minutes.
- Find the z-score of a 38-minute delivery. (1 point)
- Use the 68-95-99.7 rule to estimate the percent of deliveries that take longer than 38 minutes. (1 point)
- Of 600 deliveries, about how many take longer than 38 minutes? (1 point)

What does the first half of the test check?
The first item gives Maya’s violin hours, 4, 6, 6, 8 and 11, so the mean is 7. Next, the bulb and apple items use normal curves with stated means and deviations. Convert to z-scores before reading a table. Priya’s two scores need a fair comparison, so compute both z-scores and then decide which is higher.
How do you answer the study-design items?
A hospital assigns 80 patients to a pill or a placebo at random. That is an experiment, so a cause-and-effect conclusion is allowed. The principal who polls the first 60 students at a door has a biased sample. Suggest numbering all 1,200 students and choosing names with random numbers.
What is expected on the margin-of-error and delivery items?
Maya’s simulation shows 200 sample results from a population with 55% support. Read the middle 95% of the histogram and halve its width. The delivery item has mean 28 minutes and deviation 5. Therefore sketch the curve, shade the region and then use a table.
How can you use the last minutes wisely?
Check that each probability lies between 0 and 1. Then confirm that every conclusion mentions the context in a sentence. Afterward, grade with the key and keep a list of the z-score questions you missed.

Printable PDF · Test
Algebra 2 Data, Normal Distributions and Statistical Inference test
Download the PDF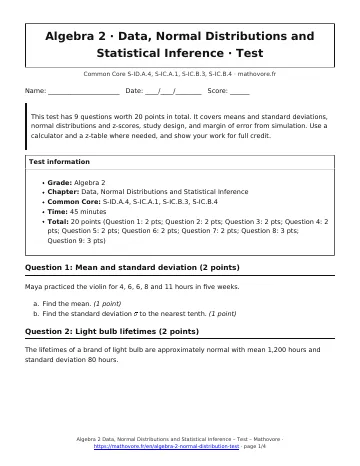
See every chapter on the Algebra 2 math page.