



This answer key gives a full worked solution for each of the 24 problems, including every relative frequency, residual and prediction. Compare each step with your own work and look for the usual slips: dividing by the wrong total, reversing a residual, or reading a correlation from its sign instead of its size.
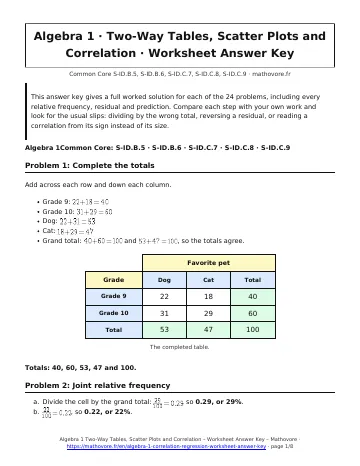
Problem 1: Complete the totals
Add across each row and down each column.
- Grade 9: \(22+18=40\)
- Grade 10: \(31+29=60\)
- Dog: \(22+31=53\)
- Cat: \(18+29=47\)
- Grand total: \(40+60=100\) and \(53+47=100\), so the totals agree.
Totals: 40, 60, 53, 47 and 100.
Problem 2: Joint relative frequency
- Divide the cell by the grand total: \(\frac{29}{100}=0.29\), so 0.29, or 29%.
- \(\frac{22}{100}=0.22\), so 0.22, or 22%.
Problem 3: Marginal relative frequency
- Use the Cat column total: \(\frac{47}{100}=0.47\), so 47%.
- Use the Grade 10 row total: \(\frac{60}{100}=0.60\), so 60%.
Problem 4: Conditional frequency by row
The condition is grade 9, so divide by the Grade 9 total, 40.
Dog: \(\frac{22}{40}=0.55\). Cat: \(\frac{18}{40}=0.45\). Check: \(0.55+0.45=1\).
55% prefer dogs and 45% prefer cats.
Problem 5: Conditional frequency by column
The condition is dog, so divide by the Dog total, 53.
Grade 9: \(\frac{22}{53}\approx 0.415\). Grade 10: \(\frac{31}{53}\approx 0.585\). Check: \(0.415+0.585=1.000\).
About 41.5% are in grade 9 and 58.5% are in grade 10.
Problem 6: Association in a two-way table
Music on: \(\frac{44}{80}=0.55\). Music off: \(\frac{66}{120}=0.55\).
The two conditional relative frequencies are equal, so knowing whether a student listens to music does not change the chance of scoring above 80. There is no evidence of an association.
Problem 7: Fill in a two-way table
Work from the totals.
- Band, grade 10: \(50-28=22\)
- Grade 10 total: \(80-36=44\)
- No band, grade 9: \(36-28=8\)
- No band total: \(80-50=30\)
- No band, grade 10: \(44-22=22\), and \(8+22=30\) confirms it.
Given grade 9: \(\frac{28}{36}=\frac{7}{9}\approx 0.778\). About 77.8% of grade 9 students are in the band.
Problem 8: Classify scatter plots
- Plot A rises from left to right: positive (here \(r\approx 0.98\)).
- Plot B is a cloud with no direction: no correlation (\(r\approx 0.08\)).
- Plot C falls from left to right: negative (\(r\approx -0.99\)).
The weakest linear relationship is Plot B, because its points do not follow any line.
Problem 9: Describe a scatter plot
The points trend downward, so the direction is negative: older cars tend to cost less. Eight of the nine points follow a nearly straight line, so the form is linear and the association is strong (\(r\approx -1.00\) without the odd point).
The point (9, 17) is an outlier: the 9-year-old car costs more than the 8-year-old car. With it included, \(r\approx -0.86\).
Problem 10: Write the line of fit
- Slope: \(m=\frac{18-6}{7-1}=\frac{12}{6}=2\). Use (1, 6): \(6=2(1)+b\), so \(b=4\). y=2x+4. Check with (7, 18): \(2(7)+4=18\).
- \(y=2(9)+4=22\). About 22 free throws.
Problem 11: Predict from a line
- \(y=2.5(88)-100=220-100=120\). About 120 cups.
- Solve \(2.5x-100=90\). Add 100: \(2.5x=190\). Divide by 2.5: \(x=76\). At \(76^{\circ}\text{F}\).
Problem 12: Interpret slope and intercept
- Slope, -1.6: each additional absence is associated with a predicted drop of 1.6 points in the final grade.
- Y-intercept, 91.4: a student with 0 absences is predicted to have a final grade of 91.4.
Zero absences is a realistic value, so the intercept has a real meaning here.
Problem 13: When the intercept has no meaning
- Each extra inch of height is associated with a predicted increase of 0.36 in shoe size.
- The intercept, -14.2, would be the predicted shoe size at a height of 0 inches. It does not make sense: nobody has a height of 0 inches and no shoe size is negative. The data cover only teenage heights, so 0 is far outside them.
- \(y=0.36(70)-14.2=25.2-14.2=11.0\). Size 11.
Problem 14: Compute residuals
Residual = actual – predicted.
- Sofia: predicted \(5(4)+52=72\); residual \(77-72=5\). +5, above the line.
- Noah: predicted \(5(6)+52=82\); residual \(79-82=-3\). -3, below the line.
Problem 15: Residuals in a table
-
x Actual Predicted Residual 1 9 8 +1 2 10 11 -1 3 16 14 +2 4 15 17 -2 5 21 20 +1 - The residuals at \(x=3\) and \(x=4\) are +2 and -2, so those two points are farthest from the line, one above and one below.
- \(1+(-1)+2+(-2)+1=1\). The sum is 1.
Problem 16: Read residual plots
- Plot A. Its residuals are scattered randomly above and below zero with no pattern, so the line captures the trend.
- The residuals in Plot B form a U shape, so the data are curved. A quadratic function (a parabola) is a better choice to try.
Problem 17: Match r to the plot
- Plot 1 rises and hugs a line: r = 0.96 (strong positive).
- Plot 2 falls and hugs a line: r = -0.98 (strong negative).
- Plot 3 rises but is widely spread: r = 0.73 (moderate positive).
The sign gives the direction; the size of r gives the strength.
Problem 18: Compare strength of r
Strength depends on the distance from 0, so compare the absolute values: \(|-0.88|=0.88\), \(0.72\), \(|-0.40|=0.40\), \(0.15\).
Strongest to weakest: -0.88, 0.72, -0.40, 0.15.
No. The sign shows direction only, and 0.88 is greater than 0.72, so \(r=-0.88\) is the stronger relationship.
Problem 19: Choose the correct conclusion
Statement B. A positive correlation describes a tendency between the two variables.
- A claims that buying books causes a higher score. Only an experiment could show that.
- C claims the opposite direction of cause without evidence.
- D claims there are no other factors, but r = 0.78 is not 1 and other variables matter.
Problem 20: Find the lurking variable
No. Buying bigger shoes will not improve anyone’s reading. The lurking variable is age: older children have larger feet and have also had more years of reading instruction, so both variables increase with age.
Problem 21: Hot chocolate sales
- \(y=-1.3(25)+112=-32.5+112=79.5\). About 80 cups.
- Predicted: \(-1.3(40)+112=60\). Actual: 62. Residual: \(62-60=2\). +2
- Each 1-degree rise in temperature is associated with about 1.3 fewer cups sold.
- \(y=-1.3(90)+112=-117+112=-5\). A negative number of cups is impossible. The data stop at 70 degrees, so using the line at 90 is extrapolation and unreliable.
Problem 22: Lunch choices by grade
- \(\frac{66}{250}=0.264\), so 26.4%.
- \(\frac{132}{250}=0.528\), so 52.8%.
- Grade 9: \(\frac{78}{130}=0.60\). Grade 10: \(\frac{54}{120}=0.45\).
- Yes. 60% of grade 9 students buy lunch but only 45% of grade 10 students do, a 15-point difference, so grade and lunch choice appear to be associated. Grade 9 students are more likely to buy lunch.
Problem 23: Choose a function type
- The points curve upward, and the counts do not grow by a constant amount: the differences are 2, 4, 8, 16, 32. A line would leave a U-shaped residual plot.
- Each count is 2 times the previous one, so the model is exponential: \(y=2\cdot 2^{x}\). Check: \(2\cdot 2^{3}=16\).
- \(y=2\cdot 2^{6}=2\cdot 64=128\). 128 cells.
Problem 24: Extrapolation risk
- \(y=2.2(13)+30=28.6+30=58.6\). About 58.6 inches. Age 13 is inside the data range, so this is interpolation and is reasonable.
- \(y=2.2(40)+30=88+30=118\) inches, which is 9 feet 10 inches. This is not believable. People stop growing in their teens, but the line keeps rising forever. Age 40 is far outside the range 10 to 15, so this extrapolation is unreliable.
See every chapter on the Algebra 1 math page.