
This algebra 1 graphs solutions lesson explains graphs as solution sets, linear-quadratic systems and exponential expressions in one printable page, with definitions, a method and a worked example.
The graph of an equation in two variables is the set of all its solutions, so every point on it makes the equation true. A line and a parabola meet where their expressions are equal. An exponential graph has a y-intercept, no x-intercept and a horizontal asymptote, and exponent rules rewrite its rate.
Algebra 1 Graphs Solutions Lesson: key facts
- Standards A-REI.D.10, A-REI.C.7, F-IF.C.7e and A-SSE.B.3c: graphs as solution sets, linear-quadratic systems, exponential graphs and rewriting exponentials.
- A point is on the graph of an equation exactly when its coordinates satisfy the equation.
- To solve a line-parabola system, set the two expressions for \(y\) equal, solve for \(x\), then find \(y\). There can be 2, 1 or 0 solutions.
- For \(y=a\cdot b^{x}\) the y-intercept is \((0,a)\), there is no x-intercept, and the x-axis is an asymptote.
- Rewrite with \(b^{mn}=(b^{m})^{n}\): \(1.15^{t}=(1.15^{1/12})^{12t}\) gives a monthly factor of about 1.0117.
How does a graph show all the solutions of an equation?
A solution of an equation in two variables is an ordered pair that makes it true. The graph of the equation is the set of all its solutions, plotted in the plane. Every point on the graph is a solution, and every solution is a point on the graph. For \(y=2x-1\), the pair \((3,5)\) works because \(2(3)-1=5\). The pair \((1,2)\) fails because \(2(1)-1=1\), not 2, so it lies off the line.
How do you solve a system with a line and a parabola?
- Set the two expressions for \(y\) equal.
- Move every term to one side so the other side is 0.
- Factor and solve for \(x\).
- Substitute each \(x\) into the linear equation to find \(y\).
- Check both points in both equations.
Solve \(y=x^{2}-4x+3\) and \(y=x-1\). Then \(x^{2}-4x+3=x-1\) gives \(x^{2}-5x+4=0\), so \((x-1)(x-4)=0\) and \(x=1\) or \(x=4\). The line gives \(y=0\) and \(y=3\), so the solutions are \((1,0)\) and \((4,3)\). A line and a parabola can meet in 2, 1 or 0 points.
How do you graph an exponential function?
For \(y=a\cdot b^{x}\) with \(a>0\), the y-intercept is \((0,a)\) because \(b^{0}=1\). There is no x-intercept, since \(b^{x}\) is never 0. When \(b>1\) the function grows: \(y\) gets very large as \(x\) increases and approaches 0 as \(x\) decreases. When \(0 < b < 1\) the function decays, and the end behavior swaps. The x-axis is a horizontal asymptote in both cases.
How do you rewrite an exponential expression to find a different rate?
Use the power rule \(b^{mn}=(b^{m})^{n}\). An account that grows by a factor of 1.15 each year has value \(1.15^{t}\) after \(t\) years. Write \(1.15^{t}=(1.15^{1/12})^{12t}\). Since \(1.15^{1/12}\approx 1.0117\), the equivalent monthly growth factor is 1.0117, a monthly rate of about 1.17%. That is less than 15% divided by 12 because each month builds on the one before.
Graphs as Solution Sets, Linear-Quadratic Systems and Exponential Expressions: frequently asked questions
Why is the graph of an equation called its solution set?
Each point on the graph has coordinates that make the equation true, and every pair that makes it true is on the graph. So the graph shows all solutions at once, even when there are infinitely many.
How many solutions can a line and a parabola have?
Two, one or none. Two means the line cuts the parabola, one means it just touches it, and none means they never meet. Setting the expressions equal and solving shows which case you have.
Why does an exponential function have no x-intercept?
An x-intercept needs \(y=0\), but \(a\cdot b^{x}\) with \(a>0\) is always positive. The graph gets close to the x-axis but never touches it, so the x-axis is an asymptote.
What is end behavior?
End behavior describes what happens to \(y\) as \(x\) gets very large in either direction. For \(y=3(2)^{x}\), \(y\) grows without bound to the right and approaches 0 to the left.
Why is the monthly rate not just the yearly rate divided by 12?
Growth compounds: each month grows from a larger amount. The monthly factor must multiply by itself 12 times to give the yearly factor, so it is the 12th root of 1.15, not 1 plus 0.15 divided by 12.
How to use this algebra 1 graphs solutions lesson
Use this algebra 1 graphs solutions lesson before the worksheet, then check what you learned with the quiz.

Printable PDF · Lesson
Algebra 1 Graphs as Solution Sets, Linear-Quadratic Systems and Exponential Expressions lesson
Download the PDF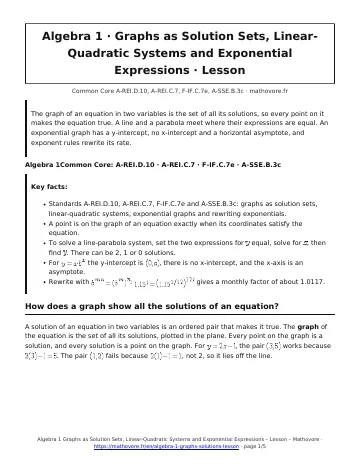
- Graphs as Solution Sets, Linear-Quadratic Systems and Exponential Expressions worksheet (23 problems)
- Graphs as Solution Sets, Linear-Quadratic Systems and Exponential Expressions quiz (10 questions)
- Graphs as Solution Sets, Linear-Quadratic Systems and Exponential Expressions test (45 minutes)
- Previous lesson: Building Functions and Inverses
See every chapter on the Algebra 1 math page.