
This algebra 1 statistics one variable lesson explains statistics: center, spread and data displays in one printable page, with definitions, a method and a worked example.
Statistics describes a data set with a display, a center and a spread. Dot plots, histograms and box plots show its shape. The mean and median measure center, while the IQR and standard deviation measure spread. Outliers pull the mean and standard deviation far more than the median and IQR.
Algebra 1 Statistics One Variable Lesson: key facts
- Standards S-ID.A.1, S-ID.A.2 and S-ID.A.3: represent one-variable data with dot plots, histograms and box plots, compare center and spread, and interpret shape and outliers.
- The IQR is Q3 minus Q1 and measures the spread of the middle 50% of the data.
- Standard deviation is a typical distance from the mean: the square root of the average squared difference.
- A value is an outlier if it is below Q1 minus 1.5 IQR or above Q3 plus 1.5 IQR.
- Use mean and SD for symmetric data; use median and IQR for skewed data or data with outliers.
What do dot plots, histograms and box plots show?
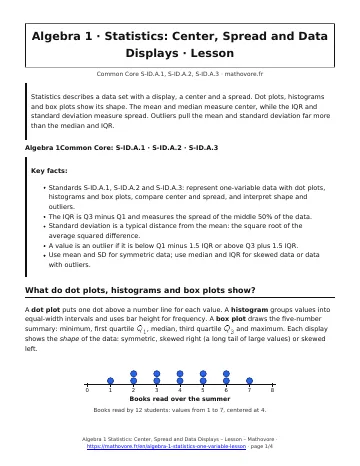
A dot plot puts one dot above a number line for each value. A histogram groups values into equal-width intervals and uses bar height for frequency. A box plot draws the five-number summary: minimum, first quartile \(Q_1\), median, third quartile \(Q_3\) and maximum. Each display shows the shape of the data: symmetric, skewed right (a long tail of large values) or skewed left.
How do you find the median, quartiles and IQR?
- Order the data from least to greatest.
- The median is the middle value, or the mean of the two middle values when the count is even.
- \(Q_1\) is the median of the lower half and \(Q_3\) is the median of the upper half. With an odd count, leave out the median.
- The interquartile range is \(\text{IQR}=Q_3-Q_1\), the spread of the middle 50% of the data.
Worked example. The books data have 12 values. The median is \(\frac{4+4}{2}=4\). The lower half \(1,2,2,3,3,4\) has median \(2.5\) and the upper half \(4,5,5,6,6,7\) has median \(5.5\). So \(\text{IQR}=5.5-2.5=3\).
What does standard deviation measure?
The standard deviation (SD) is a typical distance of the values from the mean. Treating the data as a whole group: find the mean, subtract it from every value, square each difference, average the squares, then take the square root. For \(2,4,4,4,5,5,7,9\) the mean is 5.
| Value | 2 | 4 | 4 | 4 | 5 | 5 | 7 | 9 |
|---|---|---|---|---|---|---|---|---|
| Minus the mean | \(-3\) | \(-1\) | \(-1\) | \(-1\) | 0 | 0 | 2 | 4 |
| Squared | 9 | 1 | 1 | 1 | 0 | 0 | 4 | 16 |
The squares add to 32, and \(32: 8=4\), so the SD is \(\sqrt{4}=2\). A larger SD means the values are more spread out; an SD of 0 means every value is equal.
How do you compare two distributions?
Compare center (median or mean), spread (IQR or SD) and shape, and state the conclusion in context. Both classes below have a median of 76, but the IQR of Class B is twice the IQR of Class A, so Class A’s scores are more consistent.
How do outliers change center and spread?
An outlier is a value far from the rest. A common test: a value is an outlier if it is below \(Q_1-1.5\times \text{IQR}\) or above \(Q_3+1.5\times \text{IQR}\). Adding the outlier 27 to \(3,4,5,6,7\) pulls the mean and SD sharply but hardly moves the median and IQR.
| Statistic | Without 27 | With 27 |
|---|---|---|
| Mean | 5 | 8.7 |
| Median | 5 | 5.5 |
| IQR | 3 | 3 |
| SD | 1.4 | 8.3 |
Use the mean and SD for roughly symmetric data without outliers. Use the median and IQR for skewed data or data with outliers.
Statistics: Center, Spread and Data Displays: frequently asked questions
How do you find the IQR of a data set?
Order the data, find the median, then find the median of the lower half (Q1) and of the upper half (Q3). Subtract: IQR = Q3 – Q1. For 1, 2, 2, 3, 3, 4, 4, 5, 5, 6, 6, 7, Q1 = 2.5 and Q3 = 5.5, so the IQR is 3.
What does a larger standard deviation mean?
A larger standard deviation means the values are more spread out around the mean. Two data sets can have the same mean but very different standard deviations, such as 1 and 5, which signals that the second set is far less predictable.
When should you use the median instead of the mean?
Use the median, with the IQR, when the data are skewed or contain outliers, because a few extreme values drag the mean toward them. Home prices and salaries are common examples.
How do you tell whether a value is an outlier?
Compute the fences Q1 – 1.5 times IQR and Q3 + 1.5 times IQR. Any value below the lower fence or above the upper fence is an outlier. For Q1 = 15, Q3 = 19 and IQR = 4, the fences are 9 and 25.
What is the difference between a histogram and a bar graph?
A histogram shows how numerical data are spread across equal-width intervals on a number line, and its bars touch. A bar graph compares separate categories, and its bars have gaps between them.
How to use this algebra 1 statistics one variable lesson
Use this algebra 1 statistics one variable lesson before the worksheet, then check what you learned with the quiz.

- Statistics: Center, Spread and Data Displays worksheet (24 problems)
- Statistics: Center, Spread and Data Displays quiz (10 questions)
- Statistics: Center, Spread and Data Displays test (45 minutes)
- Previous lesson: Transformations, Absolute Value and Piecewise Functions
- Next lesson: Two-Way Tables, Scatter Plots and Correlation
See every chapter on the Algebra 1 math page.