This algebra 1 key features graphs quiz asks 10 multiple-choice questions on key features of graphs and rate of change, and each answer comes with a short explanation.
Ten multiple-choice questions check whether you can find intercepts, read increasing and decreasing intervals, describe end behavior, compute an average rate of change and compare functions. Pick one answer for each question, then read the explanation.
🎯 Key Features of Graphs and Rate of Change – Algebra 1 math quiz
Score: 0 / 10
Answered: 0 / 10
Question 1
What are the \(x\)-intercepts of \(f(x)=x^{2}-16\)?
A\(x=16\) and \(x=-16\)
B\(x=-4\) and \(x=4\)
C\(x=4\) only
D\(x=-16\) only
Question 2
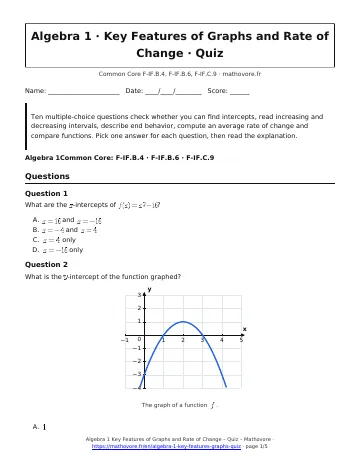
What is the \(y\)-intercept of the function graphed?The graph of a function \(f\).
A\(1\)
B\(3\)
C\(-3\)
D\(2\)
Question 3
On which interval is the function decreasing?A graph made of three line segments.
A\(-4 < x < -1\)
B\(2 < x < 5\)
C\(-1 < x < 2\)
D\(-2 < x < 3\)
Question 4
What is the relative maximum of the function in the same graph?A graph made of three line segments.
AThe value \(-1\), at \(x=2\)
BThe value 3, at \(x=5\)
CThe value \(-1\), at \(x=3\)
DThe value 3, at \(x=-1\)
Question 5
What is the end behavior of \(f(x)=-x^{2}+3\) as \(x\) gets very large?
AThe outputs decrease without bound
BThe outputs increase without bound
CThe outputs approach 3
DThe outputs approach 0
Question 6
What is the average rate of change of \(f(x)=x^{2}-3x\) from \(x=2\) to \(x=5\)?
A\(12\)
B\(8\)
C\(6\)
D\(4\)
Question 7
The table shows miles driven. What is the average speed from \(t=2\) to \(t=6\) hours?Distance driven over time.
A30 miles per hour
B33 miles per hour
C60 miles per hour
D40 miles per hour
Question 8
Function \(f\) is \(f(x)=5x+2\). Function \(g\) is graphed. Which statement is true?The graph of a function \(g\).
AFunction \(f\) has the greater rate of change and the greater \(y\)-intercept
BFunction \(g\) has the greater rate of change, and \(f\) has the greater \(y\)-intercept
CFunction \(f\) has the greater rate of change, and \(g\) has the greater \(y\)-intercept
DFunction \(g\) has the greater rate of change and the greater \(y\)-intercept
Question 9
A tank holds \(V(t)=90-6t\) gallons after \(t\) minutes. What does the \(t\)-intercept \((15,0)\) mean?
AThe tank started with 15 gallons
BThe tank is empty after 15 minutes
CThe tank loses 15 gallons each minute
DThe tank holds 90 gallons after 15 minutes
Question 10
A parabola has \(x\)-intercepts at \(x=-1\) and \(x=7\). What is its axis of symmetry?
A\(x=6\)
B\(x=3\)
C\(x=4\)
D\(x=-3\)
🎉 Quiz complete!
0 / 10
How does this quiz work?
Read each question, choose one answer among A, B, C and D, then check it: a short explanation appears after every answer. Your score out of 10 is shown at the end, and you can restart the quiz as often as you like.
What should you review before the quiz?
Reread the key facts of the lesson and the worked example. If a question is hard, go back to the matching part of the lesson, then try the quiz again. Write your work on scrap paper: most mistakes come from skipping a step, not from the idea itself.
Remember:
The x-intercepts are the inputs where f(x) = 0; the y-intercept is f(0).
Increasing means the graph rises from left to right; decreasing means it falls.
A relative maximum or minimum is a turning point, higher or lower than nearby points.
Average rate of change = (f(b) – f(a)) / (b – a), with units.
To compare functions, compare the same feature, such as rate or intercept.
How to use this algebra 1 key features graphs quiz
Retake this algebra 1 key features graphs quiz until every answer is right, then move on to the worksheet and the test.
Printable PDF · Quiz
Algebra 1 Key Features of Graphs and Rate of Change quiz