



This precalculus trig graphs worksheet gives 22 problems on graphs of trigonometric functions, ordered from easy to hard, with a separate answer key.
These problems practice graphing sine, cosine, and tangent, reading amplitude, period, phase shift, and midline from equations and graphs, and building models from data (F-TF.B.5, F-IF.C.7e, F-BF.B.3).
The set moves from basic features to writing equations from graphs. The last six problems use tides, a Ferris wheel, temperature, daylight, and a lighthouse. Show every step.
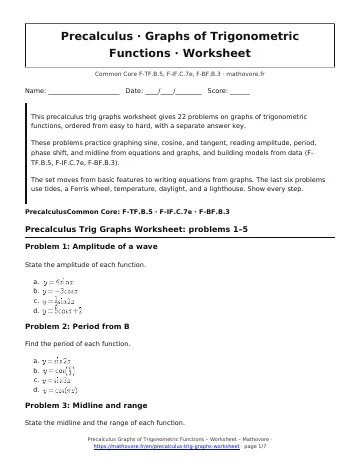
Precalculus Trig Graphs Worksheet: problems 1–5
Problem 1: Amplitude of a wave
State the amplitude of each function.
- \(y=4\sin x\)
- \(y=-3\cos x\)
- \(y=\frac{1}{2}\sin 2x\)
- \(y=5\cos x+2\)
Problem 2: Period from B
Find the period of each function.
- \(y=\sin 2x\)
- \(y=\cos(\frac{x}{2})\)
- \(y=\sin 3x\)
- \(y=\cos(\pi x)\)
Problem 3: Midline and range
State the midline and the range of each function.
- \(y=2\sin x+3\)
- \(y=-4\cos x-1\)
- \(y=\frac{1}{2}\sin x-2\)
- \(y=3\cos 2x+0.5\)
Problem 4: Five key points
Evaluate each function at \(x=0,\ \frac{\pi}{2},\ \pi,\ \frac{3\pi}{2},\ 2\pi\).
- \(y=2\cos x+1\)
- \(y=-\sin x\)
Problem 5: Read a cosine graph
The graph shows a cosine wave. State the amplitude, period, and midline, then write an equation of the form \(y=A\cos(Bx)+D\).
Precalculus Trig Graphs Worksheet: problems 6–10
Problem 6: Graph a reflected sine
Graph one full period of \(y=-2\sin x\) on \(0\le x\le 2\pi\). Label the five key points.
Problem 7: Describe transformations
Describe how the graph of each function is obtained from its parent function.
- \(y=-\frac{1}{2}\cos x+3 \text{ from } y=\cos x\)
- \(y=\sin(x+\frac{\pi}{2}) \text{ from } y=\sin x\)
- \(y=\cos(\frac{x}{4}) \text{ from } y=\cos x\)
Problem 8: Phase shift
State the phase shift, with direction, of each function.
- \(y=\sin(x-\frac{\pi}{3})\)
- \(y=\cos(x+\frac{\pi}{4})\)
- \(y=\sin(2x-\pi)\)
- \(y=\cos(3x+\frac{\pi}{2})\)
Problem 9: Read a tangent graph
The graph shows a function of the form \(y=A\tan(Bx)\). State its period and its asymptotes, then write its equation.
Problem 10: Tangent period and asymptotes
For each function, find the period and the two asymptotes closest to the y-axis.
- \(y=\tan 3x\)
- \(y=\tan(\frac{x}{2})\)
Precalculus Trig Graphs Worksheet: problems 11–15
Problem 11: Write a sine from a graph
The graph shows one cycle of a sine wave. Write an equation of the form \(y=A\sin(B(x-C))+D\).
Problem 12: Evaluate a sinusoid
Let \(f(x)=3\sin 2x+1\). Find each value.
- \(f(\frac{\pi}{12})\)
- \(f(\frac{\pi}{4})\)
- \(f(\frac{\pi}{2})\)
- \(f(\frac{3\pi}{4})\)
Problem 13: Write an equation
Write a sine or cosine function that has the given features.
- Amplitude 5, period \(\pi\), midline \(y=-2\), passes through \((0,-2)\) going up.
- Amplitude 3, period \(8\pi\), midline \(y=1\), maximum at \(x=0\).
- Amplitude 2, period 6, midline \(y=0\), passes through \((0,0)\) going up.
Problem 14: Identify B from a graph
The graph shows a sine wave that is reflected. State the amplitude and period, then write its equation in the form \(y=A\sin(Bx)\).
Problem 15: Shifted tangent
Consider \(y=2\tan(x-\frac{\pi}{4})+1\). Find the asymptotes between \(x=-\frac{\pi}{2}\) and \(x=\pi\), the center point, and the points where \(x=0\) and \(x=\frac{\pi}{2}\). Then sketch the graph.
Precalculus Trig Graphs Worksheet: problems 16–20
Problem 16: Domain of a tangent
State the domain of \(y=\tan 2x\).
Problem 17: Ferris wheel height
Maya rides a Ferris wheel. Her height in feet is \(h(t)=-40\cos(\frac{\pi t}{2})+50\), where \(t\) is in minutes.
- State the amplitude, period, and midline.
- Find her height at \(t=1\) and at \(t=2\).
- Find her height at \(t=0.5\) to the nearest tenth of a foot.
Problem 18: Tide model
The graph shows the height \(h\) of the tide, in feet, at a harbor. High tide is 11 ft at hour 3 and low tide is 3 ft at hour 9.
- Find \(A\), \(D\), the period, and \(B\).
- Write \(h(t)\) as a cosine function.
- Find the height at \(t=1\) and at \(t=6\).
Problem 19: Monthly temperature
In Denver the average temperature is coldest in January (\(30^{\circ}\text{F}\), month 1) and warmest in July (\(74^{\circ}\text{F}\), month 7). Write a cosine model \(T(m)\) and use it to predict the average temperature in April (\(m=4\)) and September (\(m=9\)).
Problem 20: Bobbing buoy
A buoy rises and falls \(1.5\) ft above and below its resting level and completes one cycle every 5 seconds. At \(t=0\) it is at rest level moving up. Write a model \(y(t)\) and find the displacement at \(t=1.25\), \(t=2.5\), and \(t=0.625\) (nearest tenth).
Precalculus Trig Graphs Worksheet: problems 21–22
Problem 21: Hours of daylight
In Seattle the length of daylight \(D(t)\) in hours is modeled by \(D(t)=4\cos(\frac{2\pi}{365}(t-172))+12\), where \(t\) is the day of the year.
- State the amplitude, midline, and period.
- Find \(D(80)\) (March 21) and \(D(1)\) (January 1) to the nearest tenth of an hour.
Problem 22: Lighthouse beam
A lighthouse stands 300 ft from a straight shore. Its beam makes angle \(\theta\) with the line perpendicular to the shore, so the beam hits the shore a distance \(d=300\tan\theta\) feet from the point straight across.
- Find \(d\) for \(\theta=\frac{\pi}{6}\), \(\frac{\pi}{4}\), and \(\frac{\pi}{3}\) (nearest tenth).
- Find \(d\) when \(\theta=1.5\) radians. Explain what happens as \(\theta\) approaches \(\frac{\pi}{2}\).

How to use this precalculus trig graphs worksheet
Print this precalculus trig graphs worksheet as a PDF, solve every problem on paper, then compare with the answer key.

See every chapter on the Precalculus math page.