Key takeaway: This AP Statistics probability lesson shows how likelihood is measured from 0 to 1 and how that measure drives later inference. Two-way tables supply joint, marginal and conditional relative frequencies. The addition and multiplication rules combine events, and independence means one event leaves the other’s chance unchanged. A discrete random variable then adds a mean and a standard deviation. The notes follow AP Statistics Unit 2.
Probability measures how likely an event is, from 0 to 1. Two-way tables give joint, marginal and conditional relative frequencies, the addition and multiplication rules combine events, and independence means one event does not change the other’s probability. A discrete random variable has a mean and standard deviation.
AP Statistics Probability Lesson: key facts
- Joint, marginal and conditional relative frequencies come from dividing by the grand total, a row or column total, or the given group.
- Complement rule: P(not A) = 1 – P(A). Addition rule: P(A or B) = P(A) + P(B) – P(A and B).
- Conditional probability: P(B|A) = P(A and B)/P(A). Events are independent when P(B|A) = P(B).
- A simulation estimates a probability by repeating a random process many times with a clear digit assignment.
- A discrete random variable has mean sum of x times P(x), and standard deviation the square root of the weighted squared deviations.
How do two-way tables show probabilities?
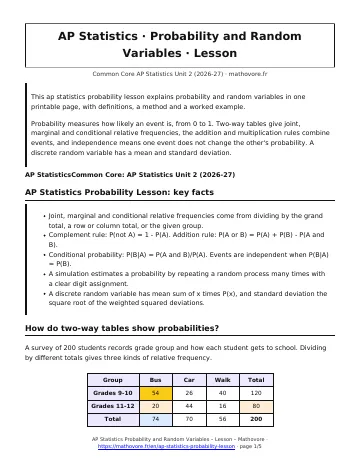
A survey of 200 students records grade group and how each student gets to school. Dividing by different totals gives three kinds of relative frequency.
- Joint: cell ÷ grand total. \(P(\text{9-10 and bus})=\frac{54}{200}=0.27\)
- Marginal: row or column total ÷ grand total. \(P(\text{bus})=\frac{74}{200}=0.37\)
- Conditional: cell ÷ total of the given group. \(P(\text{bus}|\text{11-12})=\frac{20}{80}=0.25\)
What are the basic probability rules?
The complement rule is \(P(\text{not }A)=1-P(A)\). The addition rule is \(P(A\text{ or }B)=P(A)+P(B)-P(A\text{ and }B)\). Events are mutually exclusive if they cannot happen together, so \(P(A\text{ and }B)=0\) and the last term disappears. In the survey, \(P(\text{9-10 or bus})=\frac{120+74-54}{200}=0.70\).
What are conditional probability and independence?
\(P(B|A)=\frac{P(A\text{ and }B)}{P(A)}\) and \(P(A\text{ and }B)=P(A)\cdot P(B|A)\). Events are independent when knowing one happened does not change the probability of the other: \(P(B|A)=P(B)\). Here \(P(\text{bus}|\text{11-12})=0.25\) but \(P(\text{bus})=0.37\), so grade group and bus use are not independent.
How does simulation estimate a probability?
A simulation uses chance devices to imitate a random process many times . A player makes 60% of free throws. To estimate the chance of making at least 2 of 3 shots, let digits 0 to 5 mean a make and 6 to 9 a miss, read three digits per trial, record the number of makes, and repeat. With 33 successes in 50 trials, the estimate is \(\frac{33}{50}=0.66\). More trials give a more stable estimate.
What are the mean and standard deviation of a discrete random variable?
A discrete random variable \(X\) has a probability for each value \(x\), and the probabilities sum to 1.
- List each value with its probability and check that the sum is 1.
- Multiply each value by its probability and add to get \(\mu_X\).
- Square each deviation, weight it by its probability, add, and take the square root.
Example. A carnival game pays $0, $2, $5 or $10 with probabilities 0.50, 0.30, 0.15 and 0.05. Then \(\mu_X=0.60+0.75+0.50=1.85\) dollars and \(\sigma_X=\sqrt{6.5275}\approx 2.55\) dollars. The mean is the long-run average prize per play, not a prize anyone wins on one play.
Probability and Random Variables: frequently asked questions
What is the difference between joint and conditional probability?
A joint probability is the chance that two things happen together, found by dividing a cell by the grand total. A conditional probability restricts attention to a known group, so the cell is divided by that group’s total.
What is the difference between mutually exclusive and independent events?
Mutually exclusive events cannot both happen, so P(A and B) = 0. Independent events can happen together, and knowing one happened does not change the other’s probability. Two events with positive probabilities cannot be both.
How do you check whether two events are independent?
Compare P(B|A) with P(B), or check whether P(A and B) equals P(A) times P(B). If either equality fails, even by a little, the events are not independent.
What does the mean of a random variable tell us?
It is the long-run average value of the variable over many repetitions. It need not be a possible value of the variable on a single trial.
Why does a simulation need many trials?
The relative frequency of an outcome settles near its true probability only after many repetitions. A few trials can be far from the true value by chance alone.
How do two-way tables show probabilities?
Divide a cell by the grand total for a joint probability, by a row or column total for a marginal one, and by the given group for a conditional one. For example, a survey of 250 shoppers sorted by age and payment method gives all three kinds from one table. So the denominator is the whole story: always ask which group the question restricts you to.
What are the basic rules in an AP Statistics probability lesson?
The complement rule says \(P(\text{not }A)=1-P(A)\), so a bulb with a 0.04 defect rate is fine with probability 0.96. The addition rule is \(P(A\text{ or }B)=P(A)+P(B)-P(A\text{ and }B)\). In a group of 120 students, 48 take Spanish, 36 are in band and 15 do both, so 69 do at least one. Therefore the chance is 0.575.
What do conditional probability and independence mean?
Use \(P(B|A)=\frac{P(A\text{ and }B)}{P(A)}\). If 45% of students have a job and 18% have a job and make the honor roll, then the honor roll chance among workers is 0.40. Events are independent when \(P(B|A)=P(B)\). Meanwhile, mutually exclusive events cannot happen together, so they are almost never independent.
How do simulation and random variables fit in?
A simulation assigns random digits to outcomes and repeats the trial many times . A player who makes 40% of her shots can use digits 0 to 3 for a make. Afterward, a random variable assigns numbers to outcomes. Its mean is \(\sum xP(x)\), and the spread comes from squared distances. Because a mean is a long-run average, it need not be a possible value.
How can you practice these ideas at home?
Roll two dice 50 times and record the sums in a table. Then compute the relative frequency of each sum and compare it with the theoretical value. Finally, write one sentence about why the results differ a little.

See every chapter on the AP Statistics math page.