


This ap statistics probability worksheet gives 24 problems on probability and random variables, ordered from easy to hard, with a separate answer key.
These 24 problems practice AP Statistics Unit 2: two-way tables with joint, marginal and conditional relative frequencies, probability rules, independence, simulation, and the mean and standard deviation of a discrete random variable. The first problems are direct calculations and the last six are multi-step word problems.
Write each probability in a clear notation and show the formula you use.
AP Statistics Probability Worksheet: problems 1–5
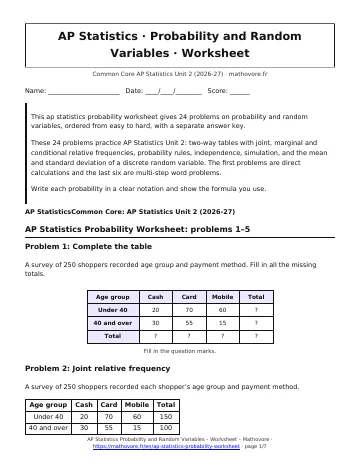
Problem 1: Complete the table
A survey of 250 shoppers recorded age group and payment method. Fill in all the missing totals.
Problem 2: Joint relative frequency
A survey of 250 shoppers recorded each shopper’s age group and payment method.
| Age group | Cash | Card | Mobile | Total |
|---|---|---|---|---|
| Under 40 | 20 | 70 | 60 | 150 |
| 40 and over | 30 | 55 | 15 | 100 |
| Total | 50 | 125 | 75 | 250 |
Find the joint relative frequency of shoppers who are 40 and over and pay by card.
Problem 3: Marginal relative frequency
A survey of 250 shoppers recorded each shopper’s age group and payment method.
| Age group | Cash | Card | Mobile | Total |
|---|---|---|---|---|
| Under 40 | 20 | 70 | 60 | 150 |
| 40 and over | 30 | 55 | 15 | 100 |
| Total | 50 | 125 | 75 | 250 |
Find the marginal relative frequency of shoppers who pay by mobile payment.
Problem 4: Conditional relative frequency
A survey of 250 shoppers recorded each shopper’s age group and payment method.
| Age group | Cash | Card | Mobile | Total |
|---|---|---|---|---|
| Under 40 | 20 | 70 | 60 | 150 |
| 40 and over | 30 | 55 | 15 | 100 |
| Total | 50 | 125 | 75 | 250 |
Among shoppers under 40, what proportion pay by card?
Problem 5: Reverse condition
A survey of 250 shoppers recorded each shopper’s age group and payment method.
| Age group | Cash | Card | Mobile | Total |
|---|---|---|---|---|
| Under 40 | 20 | 70 | 60 | 150 |
| 40 and over | 30 | 55 | 15 | 100 |
| Total | 50 | 125 | 75 | 250 |
Among shoppers who pay with cash, what proportion are 40 and over? Explain why this is different from the answer to the previous problem.
AP Statistics Probability Worksheet: problems 6–10
Problem 6: Compare conditional distributions
A survey of 250 shoppers recorded each shopper’s age group and payment method.
| Age group | Cash | Card | Mobile | Total |
|---|---|---|---|---|
| Under 40 | 20 | 70 | 60 | 150 |
| 40 and over | 30 | 55 | 15 | 100 |
| Total | 50 | 125 | 75 | 250 |
Find the distribution of payment method for each age group as percents, and decide whether payment method seems associated with age group.
Problem 7: Complement rule
A factory’s quality inspector finds that the probability a randomly chosen bulb is defective is 0.04. Find the probability that a randomly chosen bulb is not defective.
Problem 8: Spinner
The spinner has 8 equal sectors: 3 red, 2 blue, 2 green and 1 yellow. Find the probability of red or blue, and the probability of not green. Are “red” and “blue” mutually exclusive?
Problem 9: Venn diagram
Of 120 students, 48 take Spanish, 36 are in band, and 15 do both. Fill in the Venn diagram and find the probability that a randomly chosen student takes neither.
Problem 10: General addition rule
For two events, \(P(A)=0.5\), \(P(B)=0.4\) and \(P(A\text{ and }B)=0.2\). Find \(P(A\text{ or }B)\), and decide whether A and B are mutually exclusive.
AP Statistics Probability Worksheet: problems 11–15
Problem 11: Conditional probability
Of the students at a school, 45% have a job and 18% both have a job and are on the honor roll. Find the probability that a student is on the honor roll given that the student has a job.
Problem 12: Without replacement
A bag holds 5 red marbles and 3 blue marbles. Two marbles are drawn at random without replacement. Find the probability that both are red, and the probability that the first is red and the second is blue.
Problem 13: Test independence
Of 200 students, 60 are in 9th grade and 140 are in 10th grade. In the 9th grade, 36 have a library card; in the 10th grade, 84 have one. Decide whether grade and having a library card are independent.
Problem 14: Independent events
Events A and B are independent with \(P(A)=0.3\) and \(P(B)=0.6\). Find \(P(A\text{ and }B)\) and \(P(A\text{ or }B)\).
Problem 15: Tree diagram
Machine 1 makes 60% of a factory’s items and 2% of its items are defective. Machine 2 makes the other 40% and 5% of its items are defective. Complete the joint probabilities and find the probability that a random item is defective.
AP Statistics Probability Worksheet: problems 16–20
Problem 16: Simulation design
A basketball player makes 70% of her free throws. Describe how to use random digits to simulate one trial of three shots, and use the results of 20 simulated trials to estimate the probability that she makes at least 2 of 3 shots.
Problem 17: Valid distribution
The random variable \(X\) takes the values 0, 1, 2 and 3 with \(P(0)=0.1\), \(P(1)=0.3\), \(P(2)=k\) and \(P(3)=0.2\). Find \(k\) and \(P(X\ge 2)\).
Problem 18: Mean of a random variable
The number of pets \(X\) in a randomly chosen household has this distribution.
| Number of pets | 0 | 1 | 2 | 3 |
|---|---|---|---|---|
| Probability | 0.2 | 0.5 | 0.2 | 0.1 |
Find the mean of \(X\).
Problem 19: Standard deviation of a random variable
Use the distribution of the number of pets in the previous problem (probabilities 0.2, 0.5, 0.2, 0.1 for 0, 1, 2, 3 pets, mean 1.2) to find the standard deviation of \(X\).
Problem 20: Raffle
A school raffle sells 200 tickets at $5 each. One ticket wins $300, two tickets win $50 each, and four tickets win $10 each. Let \(X\) be the prize on a randomly chosen ticket. Find the mean prize, and the mean net gain per ticket for a buyer. Interpret the net gain.
AP Statistics Probability Worksheet: problems 21–24
Problem 21: Claw machine
A claw machine game wins \(X\) prizes per play with the distribution shown. Find the mean and standard deviation of \(X\), and the probability that \(X\) is within one standard deviation of the mean.
Problem 22: Die game
In a game, a player pays $3 to roll a fair die. A 6 wins $9, a 4 or 5 wins $3, and any other roll wins nothing. Let \(X\) be the winnings (before the cost). Find the mean and standard deviation of \(X\), and the expected net gain per game. Is the game fair?
Problem 23: Screening test
A condition affects 5% of a group of 1,000 people. A screening test is positive for 90% of the people with the condition and for 8% of the people without it. Make a two-way table of counts, and find the probability that a randomly chosen person tests positive and the probability that a person who tests positive has the condition.
Problem 24: Battery inspection
A box holds 10 batteries, 2 of which are defective. Two batteries are chosen at random without replacement. Let \(X\) be the number of defective batteries chosen. Find the probability distribution of \(X\), and its mean and standard deviation.

How to use this ap statistics probability worksheet
Print this ap statistics probability worksheet as a PDF, solve every problem on paper, then compare with the answer key.

See every chapter on the AP Statistics math page.