



This ap statistics proportions lesson explains inference for proportions in one printable page, with definitions, a method and a worked example.
Inference for proportions uses a sample proportion to estimate or test a population proportion. A confidence interval gives plausible values for p, while a significance test measures how surprising the sample would be if a claimed value were true. Both require random data, independence, and enough successes and failures for a normal model.
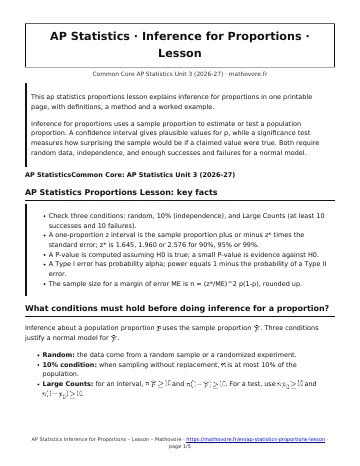
AP Statistics Proportions Lesson: key facts
- Check three conditions: random, 10% (independence), and Large Counts (at least 10 successes and 10 failures).
- A one-proportion z interval is the sample proportion plus or minus z* times the standard error; z* is 1.645, 1.960 or 2.576 for 90%, 95% or 99%.
- A P-value is computed assuming H0 is true; a small P-value is evidence against H0.
- A Type I error has probability alpha; power equals 1 minus the probability of a Type II error.
- The sample size for a margin of error ME is n = (z*/ME)^2 p(1-p), rounded up.
What conditions must hold before doing inference for a proportion?
Inference about a population proportion \(p\) uses the sample proportion \(\hat{p}\). Three conditions justify a normal model for \(\hat{p}\).
- Random: the data come from a random sample or a randomized experiment.
- 10% condition: when sampling without replacement, \(n\) is at most 10% of the population.
- Large Counts: for an interval, \(n\hat{p}\ge 10\) and \(n(1-\hat{p})\ge 10\). For a test, use \(np_0\ge 10\) and \(n(1-p_0)\ge 10\).
How is a confidence interval for a proportion built?
statistic ± (critical value)(standard error)
\[\hat{p}-z^{*}\sqrt{\frac{\hat{p}(1-\hat{p})}{n}}\quad\text{to}\quad\hat{p}+z^{*}\sqrt{\frac{\hat{p}(1-\hat{p})}{n}}\]
Critical values: \(z^{*}=1.645\) for 90%, \(1.960\) for 95%, \(2.576\) for 99%.
Example. A random sample of 200 students from a large district includes 124 who prefer a later start time, so \(\hat{p}=0.620\). The standard error is \(\sqrt{\frac{0.62(0.38)}{200}}=0.034\), and the margin of error is \(1.960(0.034)=0.067\). The 95% interval is \(0.553\) to \(0.687\). We are 95% confident that the interval captures the true proportion of all students in the district who prefer a later start.
The confidence level describes the method: about 95% of intervals built this way capture \(p\). To compare two groups, the interval for \(p_1-p_2\) uses \(\sqrt{\frac{\hat{p}_1(1-\hat{p}_1)}{n_1}+\frac{\hat{p}_2(1-\hat{p}_2)}{n_2}}\). If it contains 0, the data do not give convincing evidence of a difference.
How does a significance test for a proportion work?
- State \(H_0: p=p_0\) and \(H_a\), and define \(p\).
- Check the three conditions, using \(p_0\).
- Compute \(z=\frac{\hat{p}-p_0}{\sqrt{p_0(1-p_0)/n}}\) and the P-value.
- Compare the P-value with \(\alpha\) and conclude in context.
The P-value is the probability of a result at least as extreme as the one observed, assuming \(H_0\) is true. With \(H_0: p=0.55\) and \(H_a: p>0.55\), the sample above gives \(z=1.99\) and \(P=0.0233\). Since \(0.0233 < 0.05\), reject \(H_0\): there is convincing evidence that more than 55% prefer a later start. For two proportions, the test uses the pooled proportion \(\hat{p}_c\) in the standard error.
What are Type I error, Type II error and power?
A Type I error rejects a true \(H_0\); its probability is \(\alpha\). A Type II error fails to reject a false \(H_0\); its probability is \(\beta\). The power is \(1-\beta\), the chance of detecting a real difference. Power grows when \(n\) increases, when \(\alpha\) increases, or when the true \(p\) is farther from \(p_0\).
How large must the sample be for a given margin of error?
Solve \(z^{*}\sqrt{\frac{\hat{p}(1-\hat{p})}{n}}\le ME\) for \(n\): \(n\ge(\frac{z^{*}}{ME})^{2}\hat{p}(1-\hat{p})\). With no prior estimate, use \(\hat{p}=0.5\), then round up.
Inference for Proportions: frequently asked questions
What is the difference between a confidence level and a confidence interval?
The confidence level, such as 95%, is the long-run success rate of the method. The confidence interval is the specific range of values computed from one sample.
Why does a test use p0 but an interval use the sample proportion?
A test assumes the null value is true, so the standard error and Large Counts check use p0. An interval has no assumed value, so it estimates the standard error with the sample proportion.
What does a P-value of 0.03 mean?
If the null hypothesis were true, a sample result at least this extreme would happen about 3% of the time by chance alone. It is not the probability that the null hypothesis is true.
How can a confidence interval for a difference justify a claim?
If the interval for p1 minus p2 contains only positive values, there is convincing evidence that p1 is larger. If it contains 0, the data do not show a difference.
How do you increase the power of a test?
Take a larger sample, raise the significance level, or study a situation where the true proportion is farther from the null value. A larger sample does not raise the Type I error rate.
How to use this ap statistics proportions lesson
Use this ap statistics proportions lesson before the worksheet, then check what you learned with the quiz.

See every chapter on the AP Statistics math page.