



This ap statistics means worksheet gives 24 problems on inference for means, ordered from easy to hard, with a separate answer key.
These 24 problems practice inference for means from the AP Statistics course: t-distributions, conditions, one-sample t intervals and tests, paired data, two-sample t procedures, claims justified by confidence intervals, and choosing the right procedure. Early items check one skill; the last items are full four-step investigations.
AP Statistics Means Worksheet: problems 1–5
Problem 1: Degrees of freedom and t*
Maya takes a random sample of 18 values to build a 95% confidence interval for a mean. State the degrees of freedom and find the critical value \(t^{*}\).
Problem 2: Finding t* values
Find \(t^{*}\) for (a) a 99% interval with \(n=8\) and (b) a 90% interval with \(n=25\).
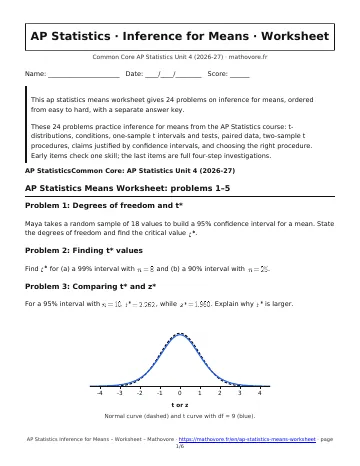
Problem 3: Comparing t* and z*
For a 95% interval with \(n=10\), \(t^{*}=2.262\), while \(z^{*}=1.960\). Explain why \(t^{*}\) is larger.
Problem 4: Checking the Normal/Large Sample condition
Diego records the wait times at a drive-thru for 12 randomly selected cars, shown below. Decide whether the Normal/Large Sample condition for a t interval for the mean wait time is met. Justify the answer.
Problem 5: Standard error of the mean
A random sample of 36 customers has a mean checkout time with a standard deviation of \(s=4.2\) minutes. Calculate the standard error of the sample mean.
AP Statistics Means Worksheet: problems 6–10
Problem 6: One-sample t interval
The commute times (in minutes) of 10 randomly selected workers at a city office are \(24, 31, 27, 35, 29, 33, 26, 30, 28, 32\). A dot plot shows no outliers and no strong skewness. Construct a 95% confidence interval for the mean commute time of all workers at the office.
Problem 7: Interpreting a t interval
The 95% confidence interval for the mean commute time at a city office is \((27.09, 31.91)\) minutes. Interpret the interval in context.
Problem 8: Mean and margin of error from an interval
A confidence interval for a population mean is \((23.4, 26.8)\). Find the sample mean and the margin of error.
Problem 9: Effect of sample size
Two random samples have the same standard deviation \(s=6\). One has \(n=25\) and the other \(n=100\). Compare the margins of error for 95% confidence intervals and explain the effect of the sample size.
Problem 10: Writing hypotheses
A phone maker advertises a mean battery life of 12 hours. Ethan suspects the mean is lower. State the null and alternative hypotheses and define the parameter.
AP Statistics Means Worksheet: problems 11–15
Problem 11: One-sample t test, right-tailed
A streaming service says the mean length of a listening session is 50 minutes. Liam thinks it is longer. A random sample of 25 sessions has \(\,\overline{x}=52.8\) minutes and \(s=9.5\) minutes, and a graph shows no strong skewness or outliers. Find the test statistic and P-value for \(H_0: \mu=50\) versus \(H_a: \mu>50\).
Problem 12: Two-sided t test
A school nurse says teens average 8 hours of sleep on school nights. In a random sample of 16 teens, the mean is \(\,\overline{x}=7.55\) hours with \(s=0.9\) hours, and a graph shows no strong skewness or outliers. Find the test statistic and P-value for a two-sided test of \(H_0: \mu=8\).
Problem 13: Interpreting a P-value
A test of \(H_0: \mu=50\) versus \(H_a: \mu>50\) for the mean listening-session length gave a P-value of 0.077 with \(\,\overline{x}=52.8\) minutes. Interpret the P-value in context.
Problem 14: Drawing a conclusion
The listening-session test gave a P-value of 0.077. State the conclusion in context at \(\alpha=0.05\), and say whether the conclusion changes at \(\alpha=0.10\).
Problem 15: Interval and test agree
A 95% confidence interval for a population mean \(\mu\) is \((4.1, 5.9)\). Decide what a two-sided significance test at \(\alpha=0.05\) concludes for (a) \(H_0: \mu=5\) and (b) \(H_0: \mu=6\).
AP Statistics Means Worksheet: problems 16–20
Problem 16: Paired or independent?
Classify each study as paired data or two independent samples. (a) Each of 20 runners is timed before and after a training plan. (b) One random sample of 30 sophomores and a separate random sample of 30 seniors take the same quiz. (c) Twelve identical twin pairs are formed; one twin in each pair is randomly assigned to a new tutoring program and the other is not.
Problem 17: Paired t interval
Eight randomly selected students typed the same passage before and after a week of practice. The numbers of typing errors are listed below. Construct a 95% confidence interval for the mean decrease in errors (before minus after). Assume the conditions are met.
| Student | 1 | 2 | 3 | 4 | 5 | 6 | 7 | 8 |
|---|---|---|---|---|---|---|---|---|
| Before | 31 | 28 | 35 | 30 | 27 | 33 | 29 | 34 |
| After | 27 | 26 | 30 | 29 | 24 | 30 | 28 | 29 |
Problem 18: Paired t test
Ten randomly selected students take a math quiz before and after a review session. The differences (after minus before) have mean \(\,\overline{x}_d=3.2\) points and standard deviation \(s_d=4.1\) points, with no strong skewness or outliers. Test whether the review session increases the mean score at \(\alpha=0.05\).
Problem 19: Two-sample t interval
Independent random samples of students take a reading test. Group 1 (\(n_1=30\)) has \(\,\overline{x}_1=78.4\) and \(s_1=8.2\); group 2 (\(n_2=28\)) has \(\,\overline{x}_2=73.1\) and \(s_2=9.5\). Assume the conditions are met. Construct a 95% confidence interval for \(\mu_1-\mu_2\), using the degrees of freedom from a calculator.
Problem 20: Two-sample t test
A teacher randomly assigns students to two study methods. Method 1 (\(n_1=20\)) has a mean score of \(\,\overline{x}_1=14.2\) with \(s_1=3.1\); method 2 (\(n_2=18\)) has \(\,\overline{x}_2=12.1\) with \(s_2=2.8\). Assume the conditions are met. Find the test statistic and P-value for \(H_a: \mu_1>\mu_2\), and state a conclusion at \(\alpha=0.05\).
AP Statistics Means Worksheet: problems 21–24
Problem 21: Justifying a claim with an interval
Two studies each give a 95% confidence interval for \(\mu_1-\mu_2\), the difference in mean weekly study hours. Interval A is \((0.6, 4.2)\) and interval B is \((-0.9, 2.5)\). For each interval, decide whether it provides convincing evidence that \(\mu_1\) is greater than \(\mu_2\). Justify the answers.
Problem 22: Selecting a procedure
Name the appropriate inference procedure for each situation. (a) Estimate the proportion of 400 randomly sampled voters who support a ballot measure. (b) Estimate the mean weight of 25 randomly selected backpacks. (c) Test whether a diet changes weight, using the weights of 12 people before and after. (d) Compare mean exam scores of two independent random samples of students. (e) Compare the proportion who improve in two randomly assigned treatment groups.
Problem 23: Four-step two-sample test
Priya randomly assigns 26 identical seedlings to fertilizer A (14 plants) or fertilizer B (12 plants). After six weeks the heights (cm) are:
A: 21.4, 24.1, 22.8, 25.0, 23.6, 22.1, 24.7, 23.3, 25.6, 22.9, 24.2, 23.8, 21.9, 24.9
B: 20.1, 22.3, 21.5, 23.0, 20.8, 22.6, 21.2, 23.4, 20.4, 22.0, 21.8, 22.9
Do the data provide convincing evidence that fertilizer A produces a greater mean height than fertilizer B? Use \(\alpha=0.05\).
Problem 24: Four-step paired test
Nine randomly selected runners complete a 5K before and after an eight-week training program. Times in minutes, before: 27.5, 29.1, 26.4, 30.2, 28.0, 27.2, 31.0, 26.8, 29.5. After: 26.9, 28.0, 26.6, 28.9, 27.1, 26.5, 29.4, 26.9, 28.2 (in the same runner order). Test at \(\alpha=0.05\) whether the program reduces the mean 5K time. The dot plot of the differences (before minus after) is shown.

How to use this ap statistics means worksheet
Print this ap statistics means worksheet as a PDF, solve every problem on paper, then compare with the answer key.

See every chapter on the AP Statistics math page.