
Key takeaway: This AP Statistics proportions worksheet offers 24 problems on inference for proportions from Unit 3. You will check conditions, build and interpret one- and two-proportion intervals, size a sample and run z tests. Later problems describe Type I errors, Type II errors and power. The final two items are complete four-step tests. Work in pencil, keep extra digits, and use the answer key afterward.
These 24 problems practice inference for proportions from the AP Statistics course: checking conditions, building and interpreting one-proportion and two-proportion intervals, choosing a sample size, running z tests, interpreting P-values, and describing Type I errors, Type II errors and power. Problems move from short skill checks to full four-step procedures.
AP Statistics Proportions Worksheet: problems 1–5
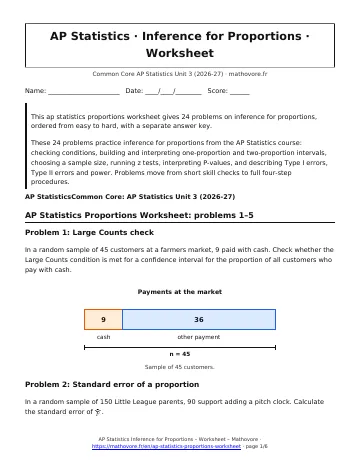
1. Large Counts check
In a random sample of 45 customers at a farmers market, 9 paid with cash. Check whether the Large Counts condition is met for a confidence interval for the proportion of all customers who pay with cash.
2. Standard error of a proportion
In a random sample of 150 Little League parents, 90 support adding a pitch clock. Calculate the standard error of \(\hat{p}\).
3. Critical values
Find the critical value \(z^{*}\) for a 90%, a 95% and a 99% confidence interval for a proportion. Round to three decimal places.
4. One-proportion z interval
A random sample of 250 youth players in a regional league includes 85 who play a second sport. Assume the random and 10% conditions are met. Check Large Counts, then construct a 95% confidence interval for the proportion of all players in the league who play a second sport.
5. Interpreting an interval
The 95% confidence interval for the proportion of players in a regional league who play a second sport is \((0.281, 0.399)\). Interpret this interval in context.
AP Statistics Proportions Worksheet: problems 6–10
6. Meaning of the confidence level
Priya writes: “There is a 95% chance that the true proportion of players who play a second sport is between 0.281 and 0.399.” Identify the error in this statement and explain what 95% confidence actually describes.
7. Sample proportion and margin of error
A confidence interval for a proportion is \((0.412, 0.508)\). Find the sample proportion \(\hat{p}\) and the margin of error.
8. Effect of confidence level
In a random sample of 400 shoppers at a mall, 140 used a coupon. Construct a 90% and a 99% confidence interval for the proportion of all shoppers who use a coupon. Explain why the intervals differ in width.
9. Sample size without a prior estimate
A polling group wants a 95% confidence interval for a proportion with a margin of error of at most 0.03. No prior estimate of the proportion exists. Find the smallest sample size that guarantees this.
10. Sample size with a prior estimate
An earlier study found that about 30% of teenagers volunteer each month. Find the smallest sample size needed for a 99% confidence interval with a margin of error of at most 0.02, using the earlier estimate.
AP Statistics Proportions Worksheet: problems 11–15
11. Writing hypotheses
A battery company states that 8% of its batteries are defective. Ethan suspects the true proportion is greater than 8%. State the null and alternative hypotheses and define the parameter.
12. Right-tailed z test
A bakery claims that at most 10% of its muffins are underweight. Sofia suspects the rate is higher. In a random sample of 120 muffins, 18 are underweight. Perform a one-proportion z test: find the standardized test statistic and the P-value.
13. Two-sided z test
A school reports that 40% of its students ride the bus. Jamal thinks the percentage has changed. In a random sample of 180 students, 63 ride the bus. Find the test statistic and the P-value for a two-sided test of \(H_0: p=0.40\).
14. Interpreting a P-value
A test of \(H_0: p=0.10\) versus \(H_a: p>0.10\) for the share of underweight muffins, based on a sample with \(\hat{p}=0.150\), gave a P-value of 0.034. Interpret this P-value in context.
15. Drawing a conclusion
The muffin test gave a P-value of 0.034. Use a significance level of \(\alpha=0.05\) to state a conclusion in context. Then decide whether the conclusion would change at \(\alpha=0.01\).
AP Statistics Proportions Worksheet: problems 16–20
16. Interval for a difference
In a random sample of 300 residents of Town A, 156 support a new park levy. In an independent random sample of 250 residents of Town B, 105 support it. Assume all conditions are met. Construct a 95% confidence interval for \(p_A-p_B\).
17. Justifying a claim with an interval
A 95% confidence interval for \(p_1-p_2\), the difference in the proportions of two groups who prefer online shopping, is \((-0.031, 0.117)\). Does the interval provide convincing evidence that the proportion is higher in group 1? Justify the answer.
18. Two-proportion z test
A company randomly assigns 200 users to App A and 200 users to App B. In App A, 130 users finish the sign-up; in App B, 112 do. Test whether App A has a higher completion rate than App B. Find the pooled proportion, the test statistic, and the P-value.
19. Describing a Type I error
A battery company claims that 8% of its batteries are defective. An inspector tests \(H_0: p=0.08\) versus \(H_a: p>0.08\). Describe a Type I error in context and state its probability if the significance level is 0.05.
20. Describing a Type II error
For the same battery test of \(H_0: p=0.08\) versus \(H_a: p>0.08\), describe a Type II error in context and one possible consequence.
AP Statistics Proportions Worksheet: problems 21–24
21. Power and Type II error
A test has power 0.72 against the alternative \(p=0.60\). Find the probability of a Type II error for that alternative, and list two ways to increase the power without changing the alternative value.
22. Computing power
A test of \(H_0: p=0.50\) versus \(H_a: p>0.50\) uses \(n=100\) and \(\alpha=0.05\). Find the power of the test when the true proportion is \(p=0.60\). Use the critical value \(z^{*}=1.645\).
23. Four-step significance test
A school newspaper claims that 70% of the seniors in a large state plan to attend college. Noah thinks the true percentage is lower. In a random sample of 220 seniors from the state (far more than 2,200 seniors), 143 plan to attend college. Carry out a significance test at the 0.05 level.
24. Interval and test agree
A 95% confidence interval for a population proportion is \((0.43, 0.57)\). Use the interval to decide what a two-sided significance test at \(\alpha=0.05\) would conclude for (a) \(H_0: p=0.60\) and (b) \(H_0: p=0.50\).

What do problems 1 to 8 of the AP statistics proportions worksheet cover?
Problem 1 asks whether Large Counts holds for 9 cash payers among 45 customers. Next, problem 2 finds the standard error for 90 supporters among 150 parents. Then problem 3 lists \(z^{*}\) for 90%, 95% and 99%. After that, problem 4 builds a 95% interval from 85 second-sport players among 250. Finally, problems 5 to 8 interpret intervals and compare 90% with 99% for 140 coupon users among 400 shoppers.
Which sample size problems appear?
Problems 9 and 10 ask for the smallest sample that achieves a margin of 0.03. Without a prior estimate, use 0.5 for \(\hat{p}\), because that choice is safest. With an earlier study showing about 30% of teenagers volunteer, use 0.3 instead. Therefore problem 10 needs a smaller sample. Always round up, since a fraction of a person is impossible.
How do the test problems progress?
Problem 11 writes hypotheses for a battery company claiming an 8% defect rate. Meanwhile, problems 12 and 13 run a right-tailed test on muffins and a two-sided test on bus riders. Next, problem 14 interprets a P-value of 0.034, and problem 15 states the conclusion at \(\alpha=0.05\). Also, problems 16 to 18 compare two groups, such as Town A with 156 of 300 supporting a levy.
What about errors, power and full tests?
Problems 19 and 20 describe Type I and Type II errors for the battery test in words. Likewise, problem 21 turns a power of 0.72 into a Type II chance, and problem 22 asks you to compute power for \(n=100\). Finally, problem 23 is a full test of a 70% college claim, and problem 24 asks you to match an interval from 0.43 to 0.57 to a two-sided decision.
How can you break up the practice?
Start with problems 1 to 10, which only need intervals and sample size. A day later, complete problems 11 to 18 on tests. Then attempt the error and power items in 19 to 24, and read the key for the wording of each conclusion.

See every chapter on the AP Statistics math page.