


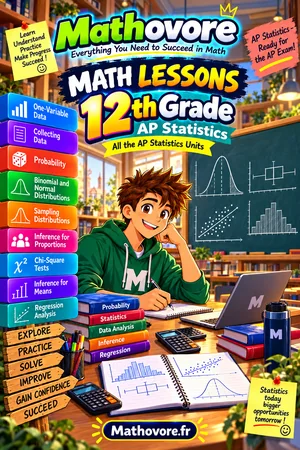
Key takeaway: AP Statistics on Mathovore has 9 chapters that move from exploring one-variable data to sampling, probability, inference and regression. Students get a reading page, problem sets, a unit test and a quiz for each chapter, with fully explained keys.
AP Statistics math chapters
Exploring One-Variable Data
Skills you build: Every analysis begins by looking at the data. You will separate categorical from quantitative variables, describe shape, center, spread, and outliers, build five-number summaries and boxplots, compare groups, and use z-scores, percentiles, and the empirical rule to locate individual values.
Collecting Data: Sampling and Experiments
Skills you build: Good conclusions depend on how data were gathered. You will frame an investigative question, compare simple, stratified, cluster, and systematic sampling, spot sources of bias, distinguish experiments from observational studies, and design a randomized experiment with controls and blocking.
Probability and Random Variables
Skills you build: Probability here is applied to chance processes and random variables. You will read two-way tables, use the addition and multiplication rules, test independence, calculate conditional probability, estimate answers by simulation, and find the mean and standard deviation of discrete random variables.
Binomial and Normal Distributions
Skills you build: Two workhorse models for counts and measurements get full treatment. You will verify binomial conditions, compute binomial probabilities with their mean and standard deviation, find areas under a normal curve with z-scores, and decide when a normal approximation to a binomial is reasonable.
Sampling Distributions
Skills you build: Statistical inference works because sample statistics follow predictable patterns. You will describe the sampling distribution of a proportion and a mean, apply the Central Limit Theorem, separate bias from variability, and find the center and spread of a difference between two statistics.
Inference for Proportions
Skills you build: Inference about a population proportion is developed from start to finish. You will verify conditions, construct and interpret confidence intervals, carry out one- and two-sample significance tests, explain P-values, and describe Type I error, Type II error, and the power of a test.
Chi-Square Tests for Homogeneity and Independence
Skills you build: Categorical data in a two-way table call for a different kind of test. You will compute expected counts, calculate the chi-square statistic and degrees of freedom, verify conditions, and carry out tests of homogeneity and independence, then state conclusions in context.
Inference for Means
Skills you build: Estimating and testing a population mean with unknown standard deviation brings in the t-distribution. You will check conditions, build confidence intervals, run one-sample and paired t tests, compare two independent means, and choose the correct inference procedure for a described study.
Regression Analysis
Skills you build: Relationships between two quantitative variables are modeled with lines. You will describe scatterplots, interpret the correlation r, fit a least-squares regression line, explain slope, intercept, and r squared in context, examine residual plots, and spot influential points before predicting.
What topics are in AP Statistics?
The course teaches students to collect, describe and interpret data. They start with one-variable data, then study sampling and experiments. Probability, random variables and the binomial and normal models follow.
The final chapters cover sampling distributions, inference for proportions and means, chi-square tests and regression.
In what order should the nine chapters be studied?
Follow the course order. Exploring data comes first, because every later idea depends on describing shape, center and spread. Collecting data teaches how a study design limits what conclusions are fair.
Probability and distributions then build the theory behind inference. Sampling distributions connect theory to samples. After that, practice inference for proportions, chi-square tests, inference for means and regression, in that order.
What should a student know before starting?
Students should be comfortable with Algebra 1 and Algebra 2 basics, such as linear equations and function notation. Prior exposure to mean, median and graphs helps. Heavy calculus is not required.
Clear writing matters more here than in many math courses. Students must explain results in context. Therefore, practice a few sentences each day, even on short quizzes.
How can students prepare for the AP Statistics exam?
The exam mixes multiple-choice questions with free-response tasks, so practice both formats. Use each test to rehearse timing. Then write full conclusions that name the parameter, state the conditions and interpret the result in context.
Check every answer against the key’s wording, and rewrite your own sentences until they match its structure. Graders look for the same four parts: hypotheses, conditions, calculation and conclusion. A correct number without context rarely earns full credit.
Why do statistics skills matter outside school?
News reports, medical studies and sports analysis all rely on data. A student who understands margin of error and bias reads them critically. As a result, the course helps in nearly every college major.
What comes after this course?
Many students take a college statistics course or move into data science electives. Others continue with AP Calculus. Either way, the inference chapters give lasting tools. Confidence intervals and significance tests appear in psychology, biology, business and public health, so the skills transfer widely.
AP Statistics: questions from parents
How big is the AP Statistics course?
It has 9 chapters, from one-variable data to regression.
Is a calculator needed?
A graphing calculator helps with distributions and tests.
Do answer keys explain context?
Yes. Keys write conclusions in context.
Can I print the worksheets?
Yes, as PDFs in US Letter size.