



This test has 8 questions about line plots, picture graphs, and bar graphs. It is worth 20 points. Students measure with a ruler, read and make graphs, and solve put-together, take-apart, and compare problems. Show your work. The test should take about 35 minutes.
- Grade: Grade 2
- Chapter: Picture Graphs, Bar Graphs and Line Plots
- Common Core: 2.MD.D.9, 2.MD.D.10
- Time: 35 minutes
- Total: 20 points (Question 1: 2 pts; Question 2: 3 pts; Question 3: 2 pts; Question 4: 3 pts; Question 5: 3 pts; Question 6: 3 pts; Question 7: 2 pts; Question 8: 2 pts)
Question 1: Measure the ribbon (2 points)
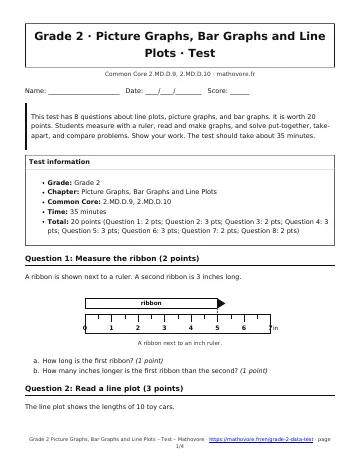
A ribbon is shown next to a ruler. A second ribbon is 3 inches long.
- How long is the first ribbon? (1 point)
- How many inches longer is the first ribbon than the second? (1 point)
Question 2: Read a line plot (3 points)
The line plot shows the lengths of 10 toy cars.
- How many toy cars are 4 inches long? (1 point)
- How many inches longer is the longest car than the shortest car? (1 point)
- How many cars are shorter than 4 inches? (1 point)
Question 3: Make a line plot (2 points)
Kai measured 7 leaves: 3, 4, 4, 5, 5, 5, and 6 inches. Draw an X on the line plot for each leaf.
Question 4: Read a picture graph (3 points)
Each circle is 1 student.
- Which game did the most students choose? (1 point)
- How many students chose tag or kickball? (1 point)
- How many more students chose soccer than swimming? (1 point)
Question 5: Read a bar graph (3 points)
Use the bar graph of pets.
- How many dogs are there? (1 point)
- How many cats and dogs are there in all? (1 point)
- How many fewer birds than cats are there? (1 point)
Question 6: Make a bar graph (3 points)
Students voted for a favorite activity. Reading: 8. Drawing: 5. Music: 6. Games: 4. Draw a bar for each activity.
Question 7: Put together and compare (2 points)
Use the activity votes from the last question: Reading 8, Drawing 5, Music 6, Games 4.
- How many students voted for reading or music? (1 point)
- How many more students voted for reading than games? (1 point)
Question 8: Take apart (2 points)
There are 16 students in Ms. Ortiz’s class. 7 chose apples and 5 chose grapes. The rest chose bananas.
- How many students chose bananas? (1 point)
- Which fruit did the most students choose? (1 point)

See every chapter on the Grade 2 math page.