Key takeaway: A grade 2 data lesson shows second graders how to measure objects, record the lengths with Xs on a line plot and read two kinds of graphs, one with circles and one with bars. On a line plot, one X records one measurement.
Children then answer put-together, take-apart and compare questions. For example, how many more students chose apples than oranges?
A line plot shows measurement data on a number line, with one X above each measurement. A picture graph uses pictures to show how many are in each category, and a bar graph uses bars. Read the title, labels, and scale, then count to answer put-together, take-apart, and compare questions.
Grade 2 Data Lesson: key facts
- Measure to the nearest whole unit, starting at 0 on the ruler.
- On a line plot, each X stands for one measurement.
- In a picture graph, read the key to learn what each picture means.
- In a bar graph, the top of each bar tells the number.
- Add to put together, subtract to take apart or compare.
How do you measure for a line plot?
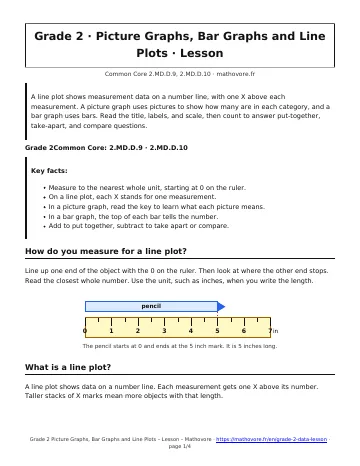
Line up one end of the object with the 0 on the ruler. Then look at where the other end stops. Read the closest whole number. Use the unit, such as inches, when you write the length.
What is a line plot?
A line plot shows data on a number line. Each measurement gets one X above its number. Taller stacks of X marks mean more objects with that length.
A line plot uses a number line and X marks. The title tells what was measured. The label under the line tells the unit. Count the X marks to find how many objects have each length.
The plot has 8 X marks, so 8 pencils were measured. The longest pencil is 7 inches. The shortest is 3 inches. The difference is \(7 – 3 = 4\) inches.
How do you read a picture graph?
A picture graph uses small pictures to show how many. Each row is a category. Read the key first. Here each circle means 1 student. Count the circles in a row to find the number.
How do you read a bar graph?
A bar graph uses bars. The bottom shows the categories. The side shows the numbers. Find the top of a bar and look across to the number on the side.
How do you solve graph problems?
Questions about graphs ask you to put numbers together, take them apart, or compare them.
| Type | What to do | Example from the bar graph |
|---|---|---|
| Put together | Add | Dogs and cats: \(7 + 5 = 12\) |
| Take apart | Subtract the known part | All pets 17, dogs 7: \(17 – 7 = 10\) are not dogs |
| Compare | Subtract the smaller from the larger | How many more dogs than cats: \(7 – 5 = 2\) |
Example: How many pets are there in all? Add all four bars: \(7 + 5 + 3 + 2 = 17\). There are 17 pets. Check it by counting on from 7: 12, 15, 17.
Picture Graphs, Bar Graphs and Line Plots: frequently asked questions
What does each X on a line plot mean?
Each X shows one measurement of one object. If there are 3 X marks above the 5, three objects measured 5 units. Count all the X marks to find how many objects were measured.
How do you measure with a ruler?
Put one end of the object at the 0 mark. Look at the other end and read the closest whole number on the ruler. Write the number with the unit, like 5 inches.
What is the difference between a picture graph and a bar graph?
A picture graph uses small pictures, and you count the pictures in each row. A bar graph uses bars, and you read the number at the top of each bar from the scale on the side.
How do you find how many more?
Compare the two numbers on the graph and subtract the smaller from the larger. If dogs are 7 and cats are 5, then \(7 – 5 = 2\), so there are 2 more dogs.
Why is the key important in a picture graph?
The key tells you what each picture stands for. In this chapter each picture is 1 student. You must read the key before you count so your answer matches the data.
How do you measure for a grade 2 data lesson?
Place the object so its left end touches 0 on the ruler. Then read the number at the right end, rounding to the nearest whole inch. If a leaf ends close to 5, record 5. Because every measurement uses the same start, the data stay fair.
What does a line plot show?
Picture a number line with X marks stacked above it. Maya measures 8 leaves and gets 4, 5, 5, 6, 3, 5, 4 and 6 inches. She draws one X per leaf, so the 5 inch column has three Xs. In other words, taller stacks mean more leaves of that length.
How do you read a picture graph?
Read the key first. If each circle stands for 1 student, count the circles in each row. A row with seven circles means seven votes. However, a key that says each picture stands for 2 would change every count.
How do you solve bar graph questions?
Follow the top of a bar across to the scale. To find how many more, subtract the smaller bar from the larger one. To find how many in all, add the bars. Finally, write a full sentence with the unit.
What should students try after this lesson?
Measure six pencils or crayons at home, and make a line plot of their lengths. Then ask your own question, such as how many are longer than 4 inches. The worksheet adds stories about ribbons, sticks and snacks.

See every chapter on the Grade 2 math page.