
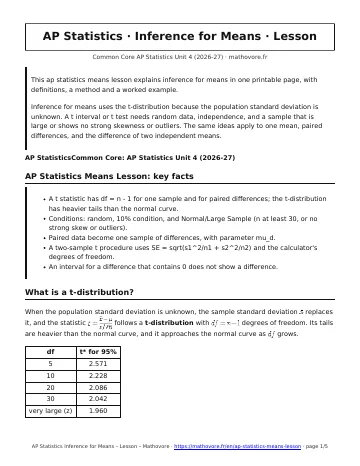
This ap statistics means lesson explains inference for means in one printable page, with definitions, a method and a worked example.
Inference for means uses the t-distribution because the population standard deviation is unknown. A t interval or t test needs random data, independence, and a sample that is large or shows no strong skewness or outliers. The same ideas apply to one mean, paired differences, and the difference of two independent means.
AP Statistics Means Lesson: key facts
- A t statistic has df = n – 1 for one sample and for paired differences; the t-distribution has heavier tails than the normal curve.
- Conditions: random, 10% condition, and Normal/Large Sample (n at least 30, or no strong skew or outliers).
- Paired data become one sample of differences, with parameter mu_d.
- A two-sample t procedure uses SE = sqrt(s1^2/n1 + s2^2/n2) and the calculator’s degrees of freedom.
- An interval for a difference that contains 0 does not show a difference.
What is a t-distribution?
When the population standard deviation is unknown, the sample standard deviation \(s\) replaces it, and the statistic \(t=\frac{\,\overline{x}-\mu}{s/\sqrt{n}}\) follows a t-distribution with \(df=n-1\) degrees of freedom. Its tails are heavier than the normal curve, and it approaches the normal curve as \(df\) grows.
| df | t* for 95% |
|---|---|
| 5 | 2.571 |
| 10 | 2.228 |
| 20 | 2.086 |
| 30 | 2.042 |
| very large (z) | 1.960 |
What conditions are needed for t procedures?
- Random sample or randomized experiment.
- 10% condition when sampling without replacement.
- Normal/Large Sample: \(n\ge 30\), or the population is approximately normal, or a graph of the sample shows no strong skewness or outliers.
How do you build and test with one mean?
Example. A random sample of 10 bags labeled 16 oz gives \(\,\overline{x}=15.92\) and \(s=0.266\). With \(df=9\) and \(t^{*}=2.262\), the 95% interval is \(15.730\) to \(16.110\) oz. For \(H_0:\mu=16\) versus \(H_a:\mu\neq 16\), \(t=-0.95\) and \(P=0.366\), which is above 0.05. The data do not give convincing evidence that the mean weight differs from 16 oz, and 16 lies inside the interval.
How are paired data handled?
When each subject gives two measurements, subtract within each pair and run a one-sample t procedure on the differences, with parameter \(\mu_d\). Eight students’ typing speeds improved by 4, 7, 2, 5, 9, 3, 6 and 4 words per minute, so \(\,\overline{x}_d=5.000\), \(s_d=2.268\), and the 95% interval for \(\mu_d\) is \(3.10\) to \(6.90\) wpm.
How do you compare two independent means?
For independent random samples, use \(SE=\sqrt{\frac{s_1^{2}}{n_1}+\frac{s_2^{2}}{n_2}}\) and the degrees of freedom from the calculator. Brand A phones (\(n=12\)) average \(9.77\) h with \(s=0.71\); brand B phones (\(n=10\)) average \(8.59\) h with \(s=0.59\). The 95% interval for \(\mu_A-\mu_B\) is \(0.60\) to \(1.76\) h (\(df=20.0\)). It excludes 0, so brand A lasts longer on average.
How do you choose the right procedure?
Ask whether the data are quantitative or categorical, and how many groups or samples there are.
Inference for Means: frequently asked questions
Why use t instead of z for means?
The population standard deviation is almost never known, so s estimates it. This extra uncertainty makes the sampling distribution heavier-tailed, which the t-distribution models.
What are degrees of freedom?
For one sample or paired differences, df = n – 1. Larger df makes the t curve closer to the normal curve and shrinks t*.
How do I check the Normal/Large Sample condition?
If n is at least 30, it is met. For smaller samples, graph the data: roughly symmetric with no outliers supports using t, while strong skewness or an outlier does not.
When are data paired?
Data are paired when two measurements come from the same subject or from matched subjects, such as before and after scores. Analyze the differences with a one-sample t procedure.
How does a confidence interval support a claim?
If a claimed value, or 0 for a difference, lies outside the interval, the data give convincing evidence against it. If it lies inside, the data do not.
How to use this ap statistics means lesson
Use this ap statistics means lesson before the worksheet, then check what you learned with the quiz.

See every chapter on the AP Statistics math page.