
This ap statistics proportions worksheet answer key solves all 24 problems of the inference for proportions worksheet step by step.
Every solution shows the conditions, the formula, the arithmetic and a conclusion in context. Intervals use the table critical values 1.645, 1.960 and 2.576, and P-values come from the standard normal model.
AP Statistics Proportions Worksheet Answer Key: problems 1–5
Problem 1: Large Counts check
Here \(\hat{p}=\frac{9}{45}=0.20\). The counts are \(n\hat{p}=9\) and \(n(1-\hat{p})=36\).
Because \(9 < 10\), the condition fails. Large Counts is not met, so a z interval is not appropriate.
Problem 2: Standard error of a proportion
\(\hat{p}=\frac{90}{150}=0.60\).
\(SE=\sqrt{\frac{0.60(0.40)}{150}}=\sqrt{0.0016}=\)0.040.
Problem 3: Critical values
For confidence level \(C\), \(z^{*}\) leaves \(\frac{1-C}{2}\) in each tail.
- 90%: area \(0.95\) to the left gives 1.645.
- 95%: area \(0.975\) to the left gives 1.960.
- 99%: area \(0.995\) to the left gives 2.576.
Problem 4: One-proportion z interval
Large Counts. \(\hat{p}=\frac{85}{250}=0.340\); the counts 85 and 165 are both at least 10.
Interval. \(SE=\sqrt{\frac{0.34(0.66)}{250}}=0.0300\), so \(ME=1.960(0.0300)=0.059\).
\(0.340-0.059=0.281\) and \(0.340+0.059=0.399\). The 95% interval is (0.281, 0.399).
Problem 5: Interpreting an interval
We are 95% confident that the interval from 0.281 to 0.399 captures the true proportion of all players in the league who play a second sport.
The sentence names the confidence level, the interval, the population, and the parameter.
AP Statistics Proportions Worksheet Answer Key: problems 6–10
Problem 6: Meaning of the confidence level
The true proportion is a fixed number, not a random quantity, so it is either in the interval or it is not. The 95% describes the method.
If many random samples of the same size were taken and a 95% interval built from each, about 95% of those intervals would capture the true proportion.
Problem 7: Sample proportion and margin of error
The sample proportion is the midpoint: \(\hat{p}=\frac{0.412+0.508}{2}=\)0.460.
The margin of error is half the width: \(ME=\frac{0.508-0.412}{2}=\)0.048.
Problem 8: Effect of confidence level
\(\hat{p}=\frac{140}{400}=0.350\) and \(SE=\sqrt{\frac{0.35(0.65)}{400}}=0.0238\).
- 90%: \(ME=1.645(0.0238)=0.039\), interval (0.311, 0.389).
- 99%: \(ME=2.576(0.0238)=0.061\), interval (0.289, 0.411).
A higher confidence level needs a larger \(z^{*}\), so the interval is wider.
Problem 9: Sample size without a prior estimate
Use the conservative value \(\hat{p}=0.5\): \(n\ge(\frac{1.960}{0.03})^{2}(0.5)(0.5)=4268.4(0.25)=1067.1\).
Round up: n = 1,068.
Problem 10: Sample size with a prior estimate
\(n\ge(\frac{2.576}{0.02})^{2}(0.30)(0.70)=16589.4(0.21)=3483.8\).
Round up: n = 3,484.
AP Statistics Proportions Worksheet Answer Key: problems 11–15
Problem 11: Writing hypotheses
Let \(p\) be the true proportion of this company’s batteries that are defective.
\(H_0: p=0.08\) and \(H_a: p>0.08\).
Problem 12: Right-tailed z test
\(H_0: p=0.10\), \(H_a: p>0.10\). Large Counts: \(120(0.10)=12\) and \(120(0.90)=108\), both at least 10.
\(\hat{p}=\frac{18}{120}=0.150\), \(SE_0=\sqrt{\frac{0.10(0.90)}{120}}=0.0274\).
\(z=\frac{0.150-0.10}{0.0274}=\)1.83, and the P-value is \(P(Z>1.83)=\)0.034.
Problem 13: Two-sided z test
Large Counts: \(180(0.40)=72\) and \(180(0.60)=108\); both at least 10.
\(\hat{p}=\frac{63}{180}=0.350\), \(SE_0=\sqrt{\frac{0.40(0.60)}{180}}=0.0365\).
\(z=\frac{0.350-0.400}{0.0365}=\)-1.37.
Two-sided P-value \(=2P(Z < -1.37)=\)0.171.
Problem 14: Interpreting a P-value
If the true proportion of underweight muffins were 0.10, there would be about a 3.4% chance of getting a sample proportion of 0.150 or greater just by random sampling variability.
It is not the probability that \(H_0\) is true.
Problem 15: Drawing a conclusion
Since \(0.034 < 0.05\), reject \(H_0\). There is convincing evidence that more than 10% of the bakery’s muffins are underweight.
At \(\alpha=0.01\), \(0.034 > 0.01\), so we fail to reject \(H_0\): the conclusion changes, and the data would not be convincing.
AP Statistics Proportions Worksheet Answer Key: problems 16–20
Problem 16: Interval for a difference
\(\hat{p}_A=0.520\), \(\hat{p}_B=0.420\), difference \(0.100\).
\(SE=\sqrt{\frac{0.52(0.48)}{300}+\frac{0.42(0.58)}{250}}=\sqrt{0.000832+0.000974}=0.0425\).
\(ME=1.960(0.0425)=0.083\). The interval is \(0.100\pm0.083\): (0.017, 0.183).
Problem 17: Justifying a claim with an interval
No. The interval contains 0, so 0 is a plausible value for the difference. Negative values are also plausible, so the data do not give convincing evidence that group 1 has the higher proportion.
Problem 18: Two-proportion z test
\(H_0: p_A=p_B\), \(H_a: p_A>p_B\). \(\hat{p}_A=0.650\), \(\hat{p}_B=0.560\).
Pooled: \(\hat{p}_c=\frac{130+112}{400}=0.605\).
\(SE=\sqrt{0.605(0.395)(\frac{1}{200}+\frac{1}{200})}=0.0489\), so \(z=\frac{0.650-0.560}{0.0489}=\)1.84.
P-value \(=P(Z>1.84)=\)0.033. Since \(0.033 < 0.05\), there is convincing evidence that App A has the higher completion rate.
Problem 19: Describing a Type I error
A Type I error rejects a true \(H_0\). The inspector concludes that more than 8% of the batteries are defective when the true proportion is actually 8%. The company might stop production unnecessarily.
The probability of a Type I error equals the significance level: 0.05.
Problem 20: Describing a Type II error
A Type II error fails to reject a false \(H_0\). The inspector does not find convincing evidence that more than 8% of the batteries are defective, even though the true proportion is greater than 8%.
Consequence: defective batteries keep being shipped to customers.
AP Statistics Proportions Worksheet Answer Key: problems 21–24
Problem 21: Power and Type II error
\(\beta=1-\text{power}=1-0.72=\)0.28.
Power increases if the sample size is increased or if the significance level \(\alpha\) is increased (accepting a higher chance of a Type I error).
Problem 22: Computing power
Step 1: rejection cutoff. Under \(H_0\), \(SD=\sqrt{\frac{0.5(0.5)}{100}}=0.05\). Reject when \(\hat{p}>0.5+1.645(0.05)=0.5822\).
Step 2: power. If \(p=0.60\), \(SD=\sqrt{\frac{0.6(0.4)}{100}}=0.0490\), so \(P(\hat{p}>0.5822)=P(Z>\frac{0.5822-0.6}{0.0490})=P(Z>-0.36)=\)0.641.
About a 64% chance of detecting the change, so \(\beta\) is about 0.36.
Problem 23: Four-step significance test
State. \(H_0: p=0.70\), \(H_a: p < 0.70\), where \(p\) is the proportion of all seniors in the state who plan to attend college; \(\alpha=0.05\).
Plan. One-proportion z test. Conditions: random sample; the population is more than 10 times the sample; \(220(0.70)=154\) and \(220(0.30)=66\) are both at least 10.
Do. \(\hat{p}=\frac{143}{220}=0.650\), \(SE_0=\sqrt{\frac{0.70(0.30)}{220}}=0.0309\), \(z=\frac{0.650-0.700}{0.0309}=-1.62\), P-value \(=P(Z < -1.62)=0.053\).
Conclude. Since \(0.053 > 0.05\), fail to reject \(H_0\). There is not convincing evidence that fewer than 70% of the state’s seniors plan to attend college.
Problem 24: Interval and test agree
A two-sided test at \(\alpha=0.05\) rejects \(H_0\) exactly when the null value lies outside the 95% interval.
- 0.60 is outside \((0.43, 0.57)\): reject \(H_0\). There is convincing evidence that \(p\neq 0.60\).
- 0.50 is inside the interval: fail to reject \(H_0\). There is not convincing evidence that \(p\neq 0.50\).
How to use this ap statistics proportions worksheet answer key
Read this ap statistics proportions worksheet answer key after trying each problem yourself, and redo any problem you missed.

Printable PDF · Worksheet Answer Key
AP Statistics Inference for Proportions worksheet answer key
Download the PDF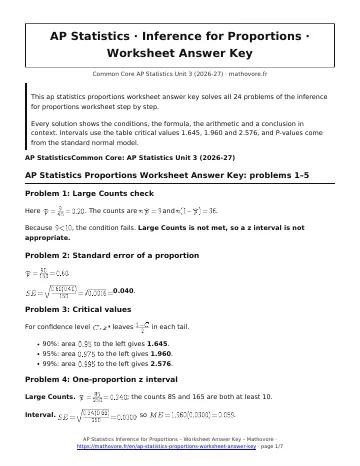
See every chapter on the AP Statistics math page.