
This ap statistics collecting data worksheet gives 23 problems on collecting data: sampling and experiments, ordered from easy to hard, with a separate answer key.
These 23 problems practice the data-collection topics of AP Statistics Unit 1: statistical questions, sampling methods, sources of bias, observational studies, experiment design, and scope of inference. The early problems build vocabulary and the later ones are free-response style, with calculations and written explanations in context.
Show the reasoning for each problem and name the method you use.
AP Statistics Collecting Data Worksheet: problems 1–5
Problem 1: Population and sample
Maya surveys 120 randomly chosen students at a school with 1,850 students. Of the 120 students, 54 ride the bus to school. Identify the population and the sample, and calculate the sample proportion \(\hat{p}\).
Problem 2: Statistical questions
Decide which of these are statistical investigative questions.
- How tall is Jamal?
- How many text messages do students at Lincoln High send on a typical day?
- Did the cafeteria sell more than 300 lunches on Monday?
- Do 11th graders at Lincoln High sleep fewer hours on school nights than 9th graders?
Problem 3: Name the sampling method
Name the sampling method in each situation.
- Liam numbers the 400 names on a class roster, picks a random number from 1 to 8, and surveys that student and every 8th name after.
- A reporter interviews the first 50 shoppers who walk into a mall.
- A radio station asks listeners to call in and vote on a new playground.
- A district randomly selects 4 of its 20 schools and surveys every student in those 4 schools.
Problem 4: Voluntary response bias
A website asks, “Do you like our new app?” and reports that 92% of the 600 people who clicked a response said yes. Explain why this result is probably biased and in which direction.
Problem 5: Random digit table
A club has 40 members, numbered 01 to 40. Select a simple random sample of 5 members by reading two-digit numbers left to right along line 101, continuing to line 102 if needed. Skip numbers that are not between 01 and 40 and skip repeats.
AP Statistics Collecting Data Worksheet: problems 6–10
Problem 6: Systematic sample
The school has 120 lockers, numbered 1 to 120, and Priya wants a systematic sample of 10 lockers. She splits the lockers into 10 blocks of 12 consecutive lockers and picks locker 7 as the starting point. List all 10 lockers in the sample.
Problem 7: Stratified sample
A school has 900 students: 285 in Grade 9, 240 in Grade 10, 210 in Grade 11 and 165 in Grade 12. The student council wants a stratified sample of 60 students with the number from each grade proportional to the size of the grade. Find the number to sample from each grade.
Problem 8: Stratified versus SRS
Explain one advantage of a stratified random sample over a simple random sample when a school wants to estimate the opinions of students in all four grades.
Problem 9: Sources of bias
Name the main source of bias in each survey.
- A phone survey uses only landline numbers, so households with only cell phones can never be chosen.
- A survey is mailed to 3,000 households, and only 420 respond.
- A police officer in uniform asks teenagers, “Do you ever skip school?”
Problem 10: Question wording
The question “Wouldn’t you agree that the school should waste less money on football?” is biased. Explain the problem and rewrite the question so that it is neutral.
AP Statistics Collecting Data Worksheet: problems 11–15
Problem 11: Study or experiment
Classify each as an observational study or an experiment. Identify the explanatory variable and the response variable.
- Researchers record the sleep hours and GPAs of 150 juniors.
- Sixty volunteers are randomly assigned either to walk 30 minutes daily or to not walk, and their resting heart rates are compared after 8 weeks.
- Diego’s coach lets players choose old or new cleats and compares the sprint times .
Problem 12: Experiment vocabulary
An agricultural class tests 2 fertilizers (X and Y) and 2 watering schedules (daily and every other day) on 24 tomato plants and measures the yield of each plant. Identify the experimental units, the factors, the number of treatments, and the response variable. How many plants receive each treatment if the plants are divided equally?
Problem 13: Random assignment
Twelve volunteers are labeled 1 to 12. A calculator command that picks random integers from 1 to 12 produces the list 3, 10, 2, 5, 2, 8, 8, 8, 11. Use the list from left to right to select the 6 volunteers who will be in Group A, skipping repeats. The rest form Group B.
Problem 14: Placebo and blinding
Noah tests whether an energy drink improves reaction time. Explain why he should give some participants a drink that looks and tastes the same but has no active ingredient, and how he could make the experiment double-blind.
Problem 15: Completely randomized design
Aisha has 30 identical tomato plants and wants to compare 3 fertilizers (A, B and C). Describe a completely randomized design for this experiment.
AP Statistics Collecting Data Worksheet: problems 16–20
Problem 16: Randomized block design
Coach Rivera has 24 runners, 12 experienced and 12 beginners, and wants to compare shoe A with shoe B. Describe a randomized block design, and explain why blocking helps.
Problem 17: Matched pairs
Sixteen sprinters each run once with shoe A and once with shoe B. Explain how to randomize this matched-pairs design and why it is useful.
Problem 18: Confounding variable
A study finds that students who eat breakfast every day have higher GPAs than students who do not. Name a possible confounding variable, and explain why the study cannot conclude that eating breakfast raises GPA.
Problem 19: Scope of inference
State the strongest conclusion that is justified in each study.
- A random sample of 200 voters is surveyed, and 56% favor a new park.
- Ninety volunteers are randomly assigned to two diets, and the diet group loses significantly more weight.
- Researchers randomly select 400 adults, randomly assign each to one of two exercise plans, and find a significant difference.
Problem 20: Town survey
A town has 5,000 residents: 2,000 in the north, 1,750 in the center and 1,250 in the south. A stratified random sample of 200 residents is planned with sample sizes proportional to the population of each area. Find the number to sample from each area, and find the probability that a particular resident is selected.
AP Statistics Collecting Data Worksheet: problems 21–23
Problem 21: Study app experiment
Mei has 40 volunteer students and wants to test whether a new study app raises quiz scores. Write a complete design for an experiment, naming the treatments, the response variable, how the 40 students are assigned, and one way to control other variables.
Problem 22: Stratified estimate
In the town survey (80 sampled in the north, 70 in the center, 50 in the south), 32, 21 and 10 sampled people support a new library. Find the sample proportion in each area, the overall sample proportion \(\hat{p}\), and a prediction of the number of supporters among all 5,000 residents.
Problem 23: Chance of selection
An SRS of 5 students is taken from a class of 40 that includes Priya and Diego. Find the probability that Priya is in the sample, and the probability that both Priya and Diego are in the sample.

How to use this ap statistics collecting data worksheet
Print this ap statistics collecting data worksheet as a PDF, solve every problem on paper, then compare with the answer key.

Printable PDF · Worksheet
AP Statistics Collecting Data: Sampling and Experiments worksheet
Download the PDF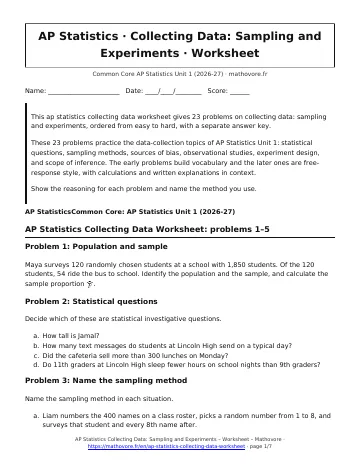
See every chapter on the AP Statistics math page.